Growing out of control: Property taxes put increasing burden on Illinois taxpayers
By Ted Dabrowski, John Klingner
Download Report
Growing out of control: Property taxes put increasing burden on Illinois taxpayers
By Ted Dabrowski, John Klingner
Download Report
Property taxes are the single largest tax in Illinois, burdening residents far more than either income or sales taxes.
Illinoisans already know they pay high property taxes.
But what is not as well known is that property taxes are outpacing residents’ ability to pay for them. Over the past 50 years, whether measured in comparison to household income, economic growth, population or inflation, all classes of property taxes – residential, commercial, industrial, etc. – have placed an increasingly unaffordable burden on Illinoisans. Since 1963, Illinois property taxes have grown 2.5 times faster than inflation and 14 times faster than the state’s population.
And looking at residential property taxes alone since 1990 shows:
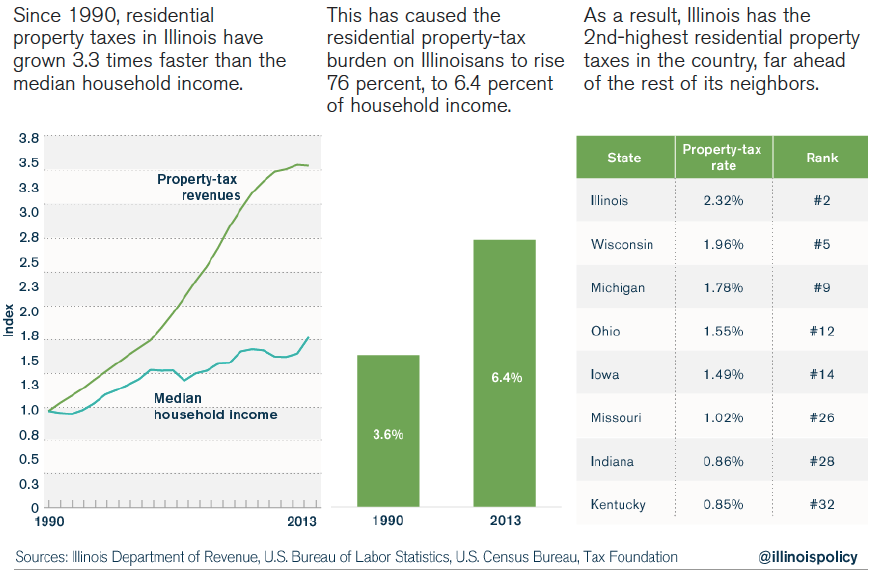
• Residential property taxes in Illinois have grown 3.3 times faster than median household incomes.
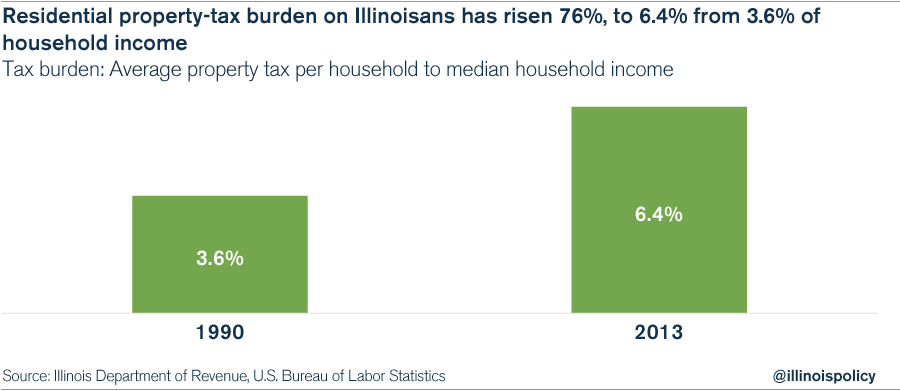
• Illinoisans’ residential property-tax burden – as a percentage of median household income – has risen 76 percent.
• If Illinois froze its residential property taxes today, it would take 28 years for residents’ property-tax burden to return to 1990 levels.1
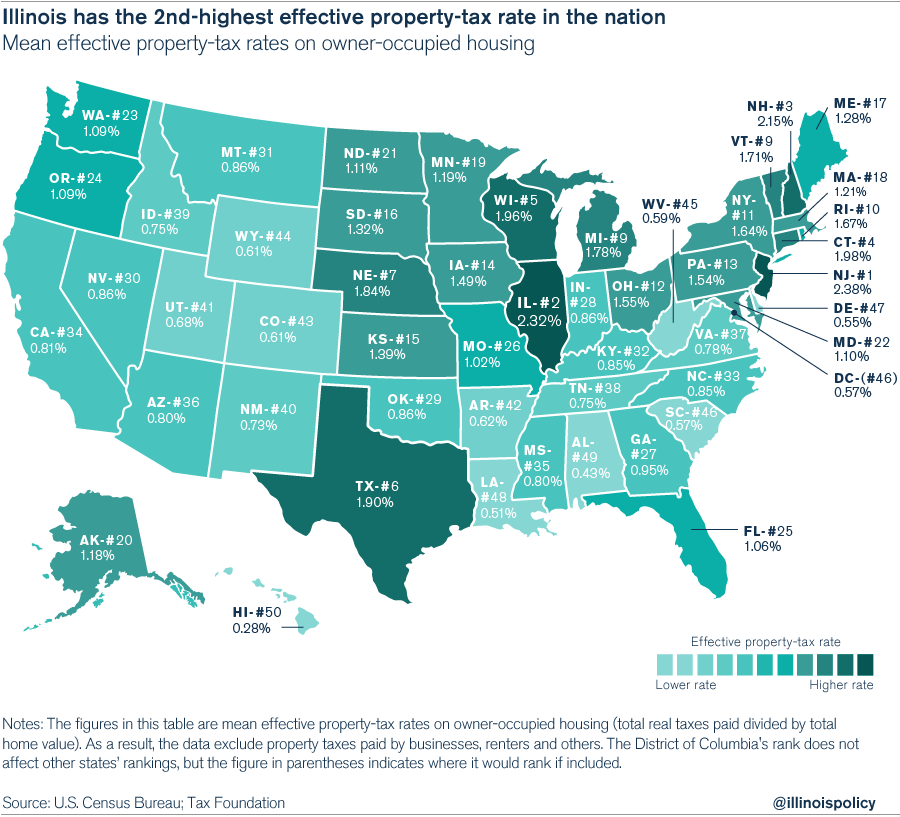
This long history of growth has resulted in an average effective property-tax rate of 2.32 percent in Illinois – the second highest in the nation, behind only New Jersey.2 And with the Chicago City Council’s passing a record property-tax hike on Oct. 28, Illinois will be in competition for the highest property taxes in the country.
How Illinois’ property taxes became the 2nd-highest in the nation
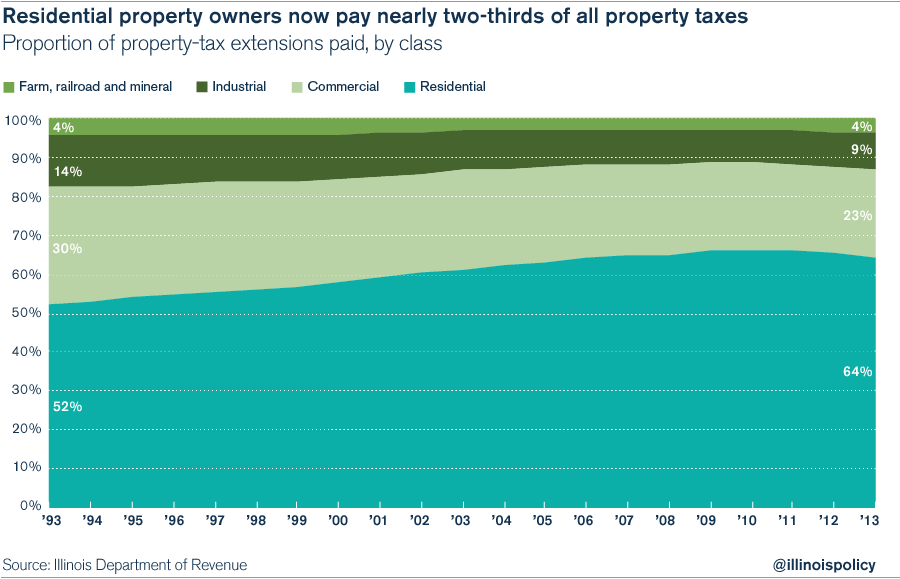
Although all property owners (residential, commercial, industrial, etc.) are paying more in property taxes now than they were 20 years ago, even after adjusting for inflation, the overall tax burden has increasingly fallen more heavily on residential property owners. Twenty years ago, residential taxpayers paid 52 percent of all property taxes. Today, they pay over 64 percent.
Thanks to the complex nature of property taxes in Illinois, it’s also difficult for taxpayers to know just where their tax dollars are going.
Property taxes are the main source of income for local governments in Illinois. The state has nearly 7,000 local government districts with the power to levy property taxes, far more than any other state. These local entities, from airport authorities to forest preserves to fire-protection districts, all levy property taxes that are layered on top of each other – making the total property-tax bill for Illinoisans more expensive and more opaque.
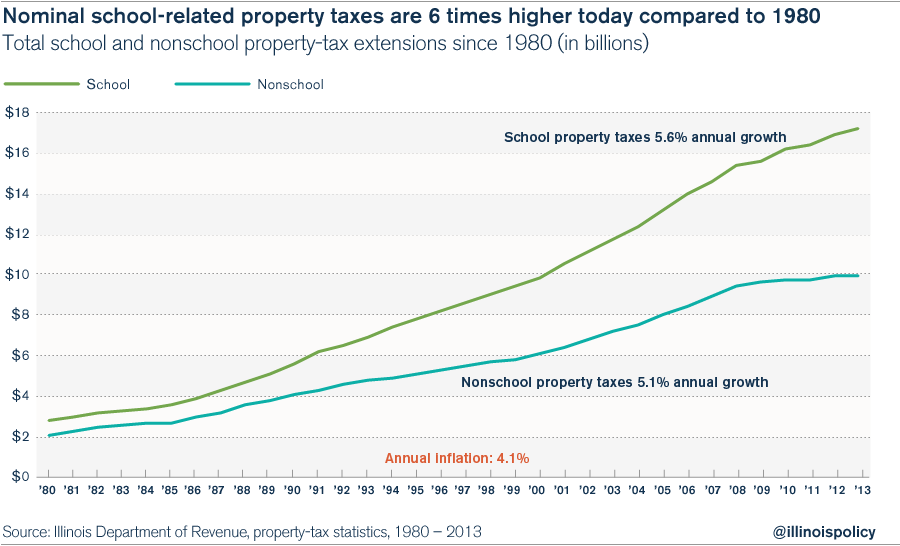
However, the biggest driver of property-tax growth throughout Illinois has been property taxes that fund schools, which constituted 63 percent of all property taxes in 2013.
Since 1970, school-related property taxes have grown at the rate of 5.6 percent a year, 25 percent faster than the 4.1 percent average annual growth in inflation.
All areas in Illinois – whether Cook County, the collar counties or downstate – have experienced growth in property taxes in excess of inflation. Individually, almost every county in Illinois has seen a dramatic increase in its property-tax burden since 2000.
And it’s not that property taxes are high in order to keep other forms of taxation low. Overall, Illinois has one of the highest overall tax burdens of any state, meaning that Illinoisans are taxed more heavily across a majority of tax categories than most other Americans. In fact, Illinois has the ninth-highest state and local tax burden per capita and the 13th-highest burden as a percentage of income.3
Fixing the problem
Illinois has attempted in the past to control the growth of property taxes, most notably through the 1991 Property Tax Extension Limitation Law, or PTELL. But the law has been largely ineffective in reducing the property-tax burden and has only added one more layer of complexity to an already overly complex, broken property-tax system.
In Illinois, capping the rate of property-tax growth is not enough. The state needs to reduce the property-tax burden for all Illinois residents. Freezing property taxes at current levels would achieve that objective by lowering the tax burden in relation to the economy and household incomes over time.
However, a property-tax freeze would only be a first step. Other reforms, such as reducing the number of taxing districts and creating new transparency and financial-planning requirements would result in greater efficiencies and would also reduce Illinoisans’ overall property-tax burden.
Illinois' high overall tax burden
Illinois’ property taxes are among the highest in the U.S.
In order to better understand how the rapid growth of property taxes has harmed Illinois taxpayers, it is important to determine how Illinois’ property taxes and total tax burden compare to those in other states.
Not only has the rapid growth in property taxes increased the burden on Illinois taxpayers, it has harmed Illinois’ economic competitiveness compared to both the state’s Midwestern neighbors and the rest of the U.S. According to several sets of analyses, Illinois’ property taxes are among the highest in the nation.
Below is a brief breakdown of several studies from the Urban Institute and the Brookings Institution, the Tax Foundation, and the American Legislative Exchange Council and the Laffer Center, which examined property taxes and overall tax burdens across the 50 states.
Urban Institute-Brookings Institution study
Illinois has the sixth-highest average home-property-tax rate in the country, according to research using U.S. Census data by the Tax Policy Center of the Urban Institute and the Brookings Institution.
However, when examining only counties with populations over 65,000, Illinois has the second-highest property-tax rate in the nation. There are 23 such counties in Illinois and 813 counties nationwide. In 2012, owners of average homes in these 23 Illinois counties paid taxes equal to 2.28 percent of their homes’ estimated market value.
Only New Jersey had a higher property-tax rate, and by only a small margin (2.32 percent versus 2.28 percent). Illinois’ rate was more than double – 104 percent higher – than the median rate among all states, which was 1.12 percent.4
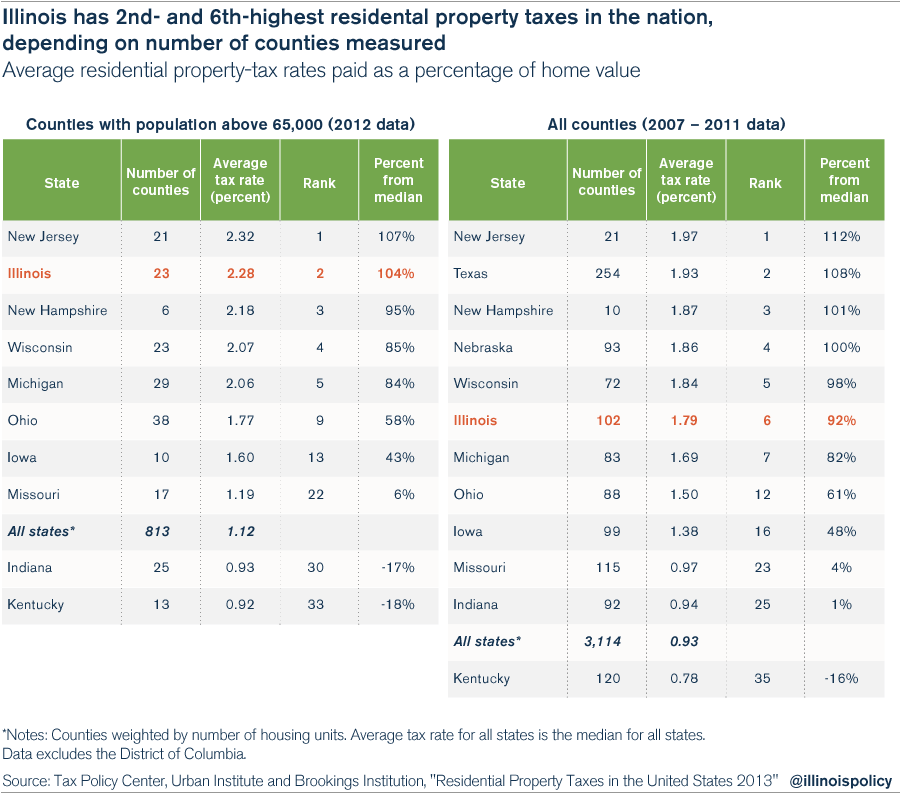
When all counties – 102 counties in Illinois and 3,114 counties nationwide – are included in the averages, which are only available as blended averages for the years 2007 through 2011 for statistical reasons, the average Illinois homeowner paid in taxes an amount equal to 1.79 percent of his home’s value. The median for all states was 0.93 percent. Illinoisans are paying 92 percent more than – or nearly double – the median of all states.5
Tax Foundation study
A second property-tax study showed similar results. Illinois has the second-highest effective property-tax rate as a percentage of home value, according to the Tax Foundation.
The authors of the study concluded: “New Jersey has the highest effective rate at 2.38 [percent] and is followed closely by Illinois (2.32 [percent]).”6
Another report by the Tax Foundation shows that Illinois ranks 44th in business-tax competitiveness when it comes to property taxes. In other words, Illinois has the seventh-most burdensome tax structure with regard to property taxes.7
ALEC-Laffer study
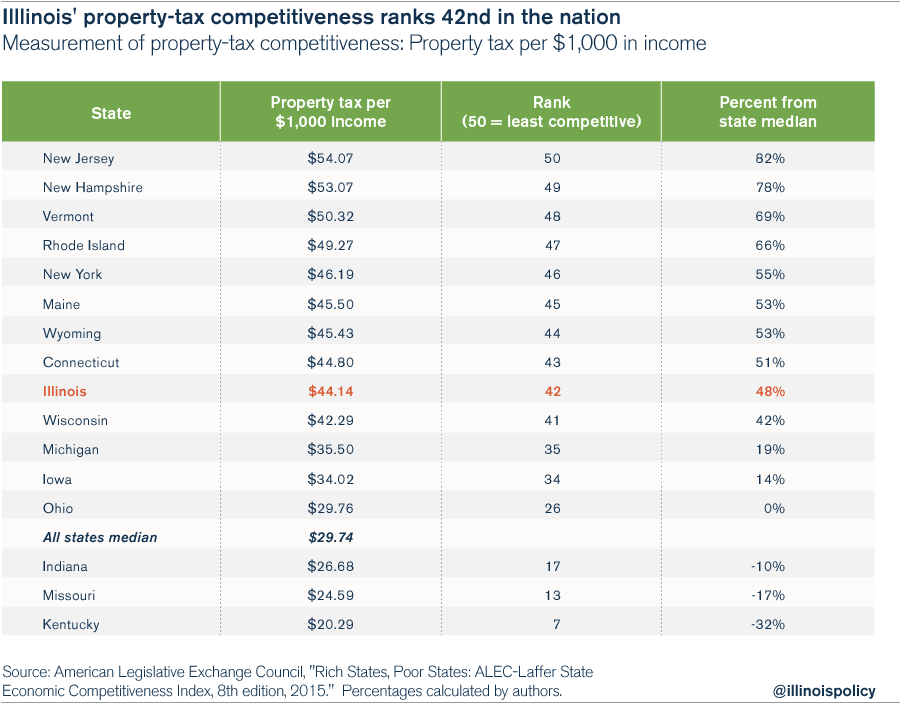
A third study, the ALEC-Laffer State Economic Competitiveness Index, compares the property-tax burden per $1,000 of income. Illinois ranks near the bottom – 42nd – in property-tax competitiveness according to this study. At $44.14 per each $1,000 of income, Illinois’ burden is 48 percent above the median of all states.8
Property taxes contribute to an overall high tax burden
The Tax Foundation concluded in its study that, unlike some other states, Illinois does not maintain high property taxes to compensate for other, lower tax rates:
“Some states with high property taxes, like New Hampshire and Texas, rely heavily on property taxes in lieu of other major tax categories; others, like New Jersey and Illinois, impose high property taxes alongside high rates in the other major tax categories.”9
According to the Tax Foundation, Illinois has the third-highest corporate income tax, the fifth-highest cellphone tax, the 10th-highest local and state sales tax, the sixth-highest local and state debt per person, the ninth-highest excise taxes, and is one of only 18 states to impose a capital stock tax.10
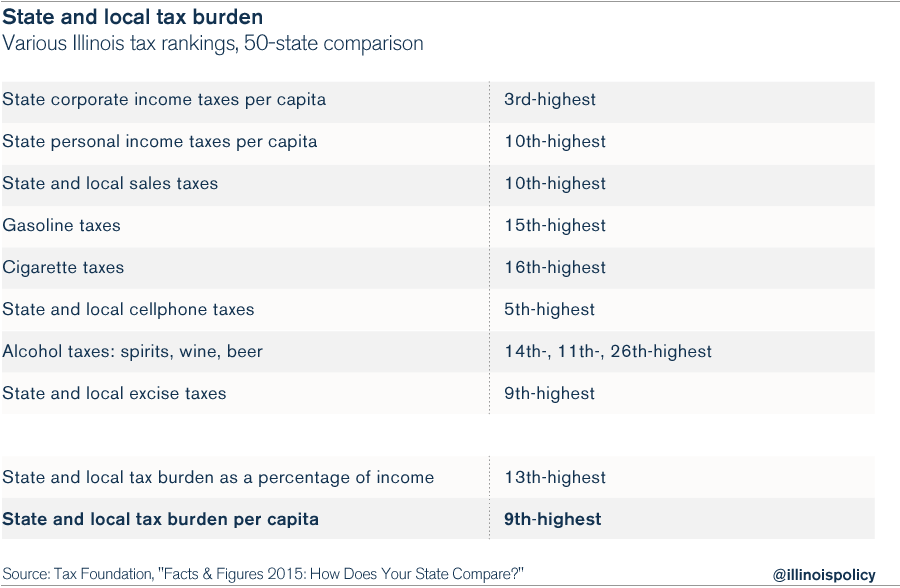
The Tax Foundation also charts a “Tax Freedom Day” for each state, marking the first day of the year when a state or the nation “as a whole has earned enough money to pay its total tax bill for the year.” Illinois trails the pack in this ranking. When Tax Freedom Day came to Illinois on April 30, 2015, it had already arrived in 42 other states.11
The authors of the ALEC-Laffer State Economic Competitiveness Index draw the same conclusion as the authors of the Tax Foundation study. Overall, Illinois’ tax structure is uncompetitive.
Illinois ranks 40th for economic outlook when considering the overall tax structure in addition to other factors. The ALEC-Laffer index includes the following factors: top marginal personal income tax, top marginal corporate-income-tax rate, personal-income-tax progressivity, sales-tax burden, estate/inheritance tax and debt service. In addition, Illinois ranks 46th in economic performance, with weak growth in the state gross domestic product (43rd), poor employment growth (44th) and extremely high absolute out-migration (48th).12
Three reputable studies, then, show essentially the same results. Illinois has some of the nation’s most burdensome property taxes.
In addition, two of those three organizations put property taxes in context. Overall, Illinois also has one of the country’s most burdensome tax structures, making it difficult to justify increasing any major tax that would add to that burden.
Breaking down Illinois' property taxes: Growth in property taxes outstrips taxpayers' ability to pay
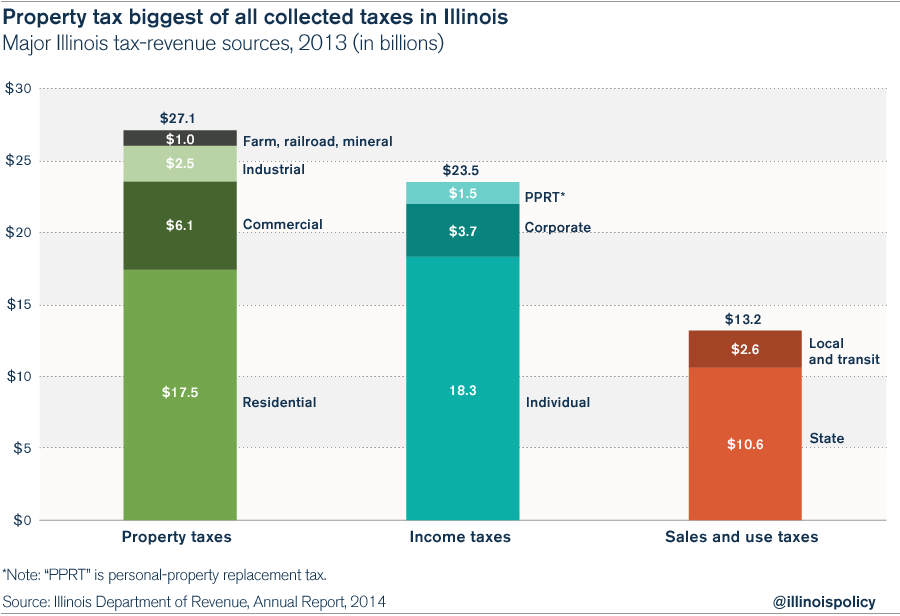
Property taxes are the biggest of all collected taxes in Illinois
Illinois collects more from residents in property taxes than any other revenue source. In 2013, more than $27 billion was collected in property taxes throughout the state. By comparison, the state collected $18.3 billion in individual income taxes during fiscal year 2013, and $5.2 billion in corporate income taxes and personal-property replacement taxes. Sales and use tax revenue for fiscal year 2013 was $13.2 billion.13
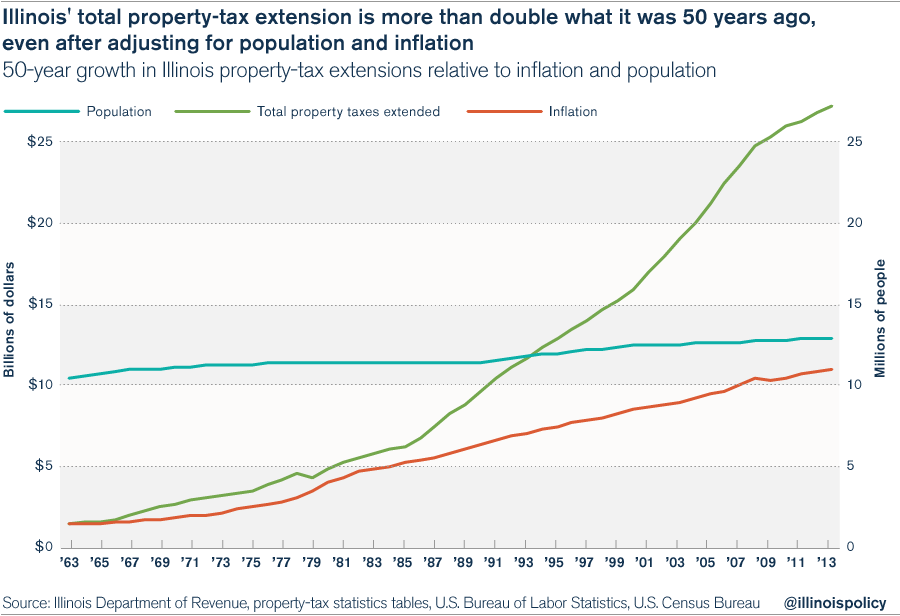
Growth in property taxes exceeds growth in inflation and population
Growth in property-tax extensions, i.e., the total amount of property taxes billed for collection, has outstripped growth in both population and inflation.
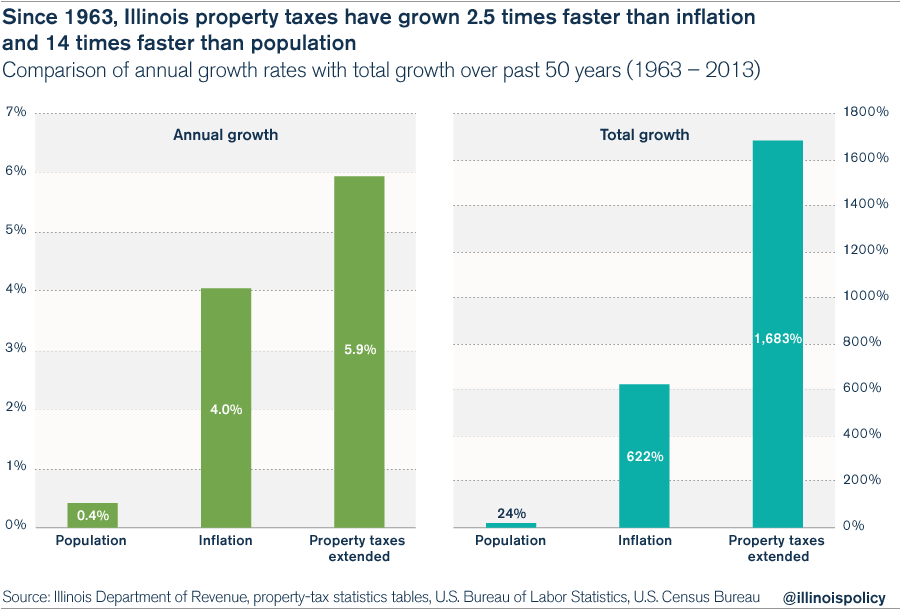
Over the past 50 years, Illinois’ population has grown at an annual rate of 0.4 percent, inflation has grown at an annual rate of 4.0 percent, and property-tax extensions have grown at a rate of 5.9 percent. In the short run, the difference is not significant, but in the long run, it is extremely important because annual growth rates compound.
Illinois’ population has grown to 12,890,522 in 2013 from 10,402,000 in 1963, an increase of 24 percent.14 The price level on the consumer price index has risen to 224.55 in 201315 from 31.1 in 1963, an increase of 622 percent. And property-tax extensions have grown to $27.13 billion from $1.52 billion, an increase of 1,683 percent.16
Although the average annual growth rate of property-tax extensions is just 1.5 percent over the combined growth rates of both population and inflation – a seemingly small number – it has had a dramatic impact over the last 50 years. Today, the state’s total property-tax extension is more than double what it was 50 years ago, even after adjusting for population growth and inflation.
The burden imposed on taxpayers by property taxes continues to grow
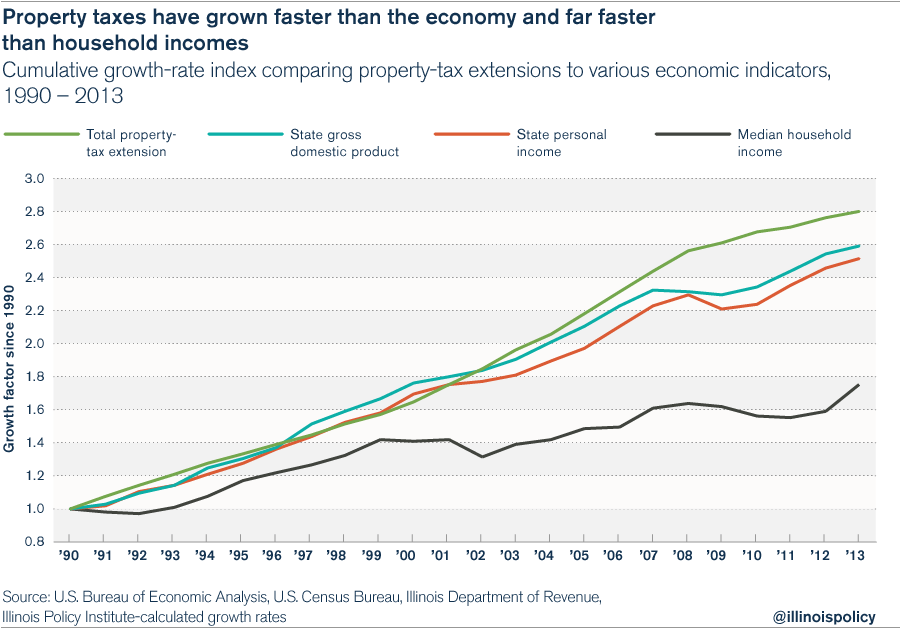
Since 1990, total property-tax extensions have grown 181 percent, exceeding the growth in the economy by approximately 10 percent. The average annual growth for property taxes was 4.6 percent versus 4.2 percent for state gross domestic product, or 4.1 percent for state personal income, which are two similar measurements of economic growth. Meanwhile, Illinois’ median household income has grown by only 76 percent for an average annual rate of only 2.5 percent. Therefore, property-tax payments have grown 60 percent more than median income.
These disparities in the growth rates have two impacts. First, property-tax extensions have been growing faster than the general economy, requiring more economic resources to be dedicated to those governmental services supported by property taxes. Second, using median household income as an indicator of affordability, household incomes have not kept up, requiring many households to set aside greater portions of their income to pay for property taxes.
Taxes are becoming less and less affordable
Over the long run, the high growth rate of property taxes – if allowed to continue – will become unsustainable for taxpayers and the Illinois economy as a whole.
For example, in 1990, property-tax extensions were 4 percent of the overall Illinois economy, as measured by state personal income. In 2013, property-tax extensions were 4.5 percent of the state personal income. The percentage fluctuated annually due to changes in the economy, but the long-run trend using linear regression analysis shows a steadily increasing burden.
Using the least-squares method for data from 1990 to 2013, there is an observable upward trend.17 If the trend is extrapolated into the future, property-tax extensions will grow to 5 percent of state personal income by 2030. Extrapolations rarely predict the future, but they do draw attention to alarming trends that need to be addressed. If left unchecked, and if historical factors continue, then Illinois property taxpayers and the economy will face a heavier property-tax burden in the future.

The average household today is less able to afford property taxes than 10 or 20 years ago.
In 1990, the average property-tax payment – calculated by dividing the total number of households, using U.S. Census Bureau data, into the total residential property-tax extension – was $1,183.18 According to the U.S. Census Bureau, the median household income in 1990 was $32,542. Dividing the average tax payment by the median household income yields 3.6 percent, which provides an indicator of the tax burden for comparison purposes.
In 2000, the average property-tax payment jumped to $2,013, and median household income rose less rapidly to $46,063, pushing the affordability indicator to 4.4 percent. In 2010, the average property tax paid increased by more than 70 percent again, to $3,552, and it increased to $3,654 by 2013. In the meantime, median household income rose only 10 percent to $50,728 between 2000 and 2010, and then increased more significantly to $57,196 in 2013.
In summary, the average residential property-tax payment has grown by a factor of 3.1 from 1990 to 2013. However, median household income has only grown by a factor of 1.8. Using the quotient of the average property-tax payment divided by the median household income as an indicator of the property-tax burden, the tax burden increased to 6.4 percent in 2013 from 3.6 percent in 1990, a 76 percent increase.19

Residential property taxes have increased the most
In the aggregate, property-tax extensions have grown to $27.1 billion in 2013 from $11.7 billion in 1993. Compared to inflation, property taxes are 50 percent higher today than what they were 20 years ago, for a net gain of $9 billion. Every single class of properties subject to property taxes has contributed to that growth.
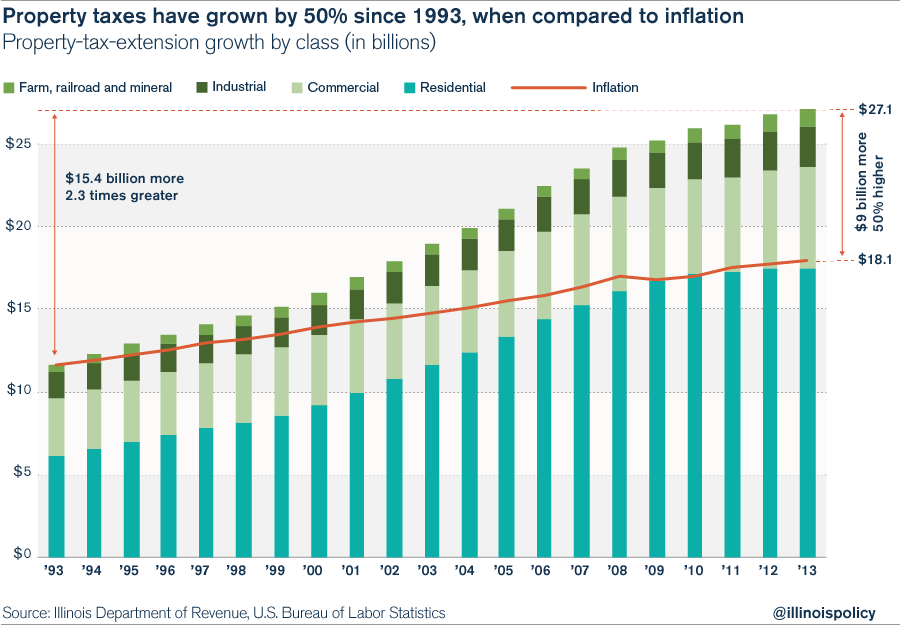
The Illinois Department of Revenue categorizes the classes as residential, commercial, industrial, farm, railroad and mineral. In each of these classes, the growth in property-tax extensions has exceeded the inflation rate over the past 20 years.
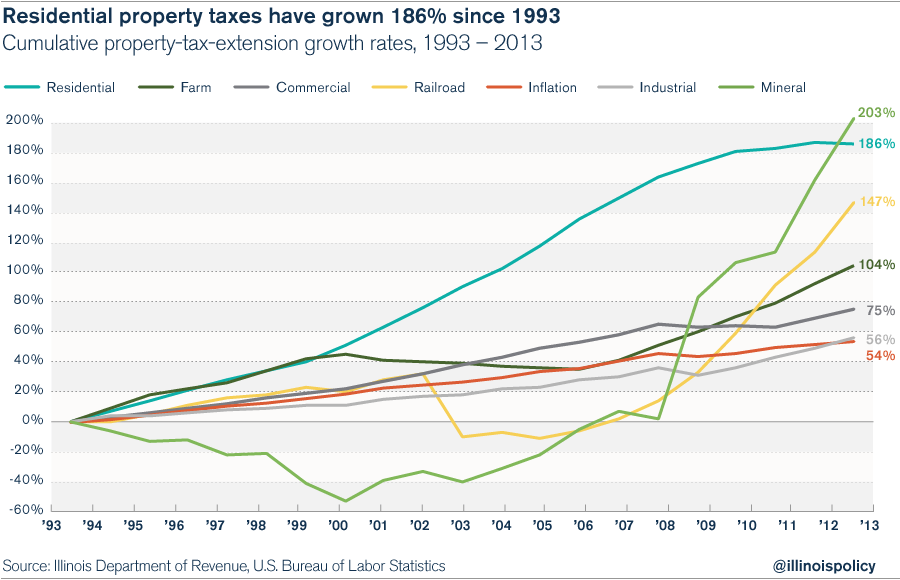
Although fluctuating widely, mineral property-tax extensions have grown the most rapidly: by a total of 203 percent since 1993, and nearly four times faster than the 54 percent growth in inflation. Residential property-tax extensions have grown steadily and with a cumulative growth rate of 186 percent that was almost as rapid as the growth for mineral property-tax extensions. Railroad property-tax extensions fluctuated widely, but ultimately grew 147 percent, nearly triple the inflation rate. The remaining classes – farm, commercial and industry – had cumulative growth rates of 104 percent, 75 percent and 56 percent, respectively.
In the aggregate, owners of property in all classes are paying more than what they were 20 years ago, even after adjusting for inflation.
But despite revenue growing faster than inflation in all classes of properties, residential property owners in the aggregate are bearing a greater share of the total property-tax burden than ever before. Residential property owners paid slightly more than half of all property-tax extensions in 1993. In 2013, however, they paid nearly two-thirds of the extensions.
Where property taxes have increased the most
Illinois’ nearly 7,000 property-tax districts impose additional costs
Illinois has the dubious distinction of having 6,963 units of local government, more than any other state in the nation. In comparison, the much bigger state of Texas – with more than twice the population of Illinois – has the second-highest number of governments: 5,147.
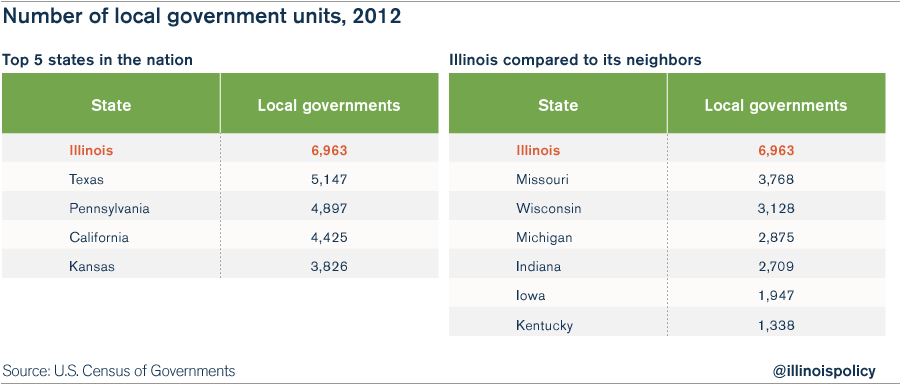
As the Illinois Policy Institute concluded in a previous report, this excessive number of governmental units is a prime cause of bureaucratic redundancies, excessive expenditures and political corruption.20
Because many local taxing units are primarily funded through property taxes, simply having more units to fund – each with its own borrowing and taxing authority, and staffing and programming costs – means that the composite tax rate and corresponding tax burden will be higher than if those local units did not exist.
The more taxing districts there are, the more entities residents have to pay. The fact that the billing procedure is unified does not diminish the overall impact because property-tax levies are layered one on top of the other, increasing the required payment.
In addition, having so many different layers of government is conducive to corruption and makes it more difficult for the public to follow all the bureaucracies and hold them accountable.
For example, the city of Chicago is not comprised of one tax code, defined as a geographic area subject to the same levies and rates from the same list of taxing districts. Rather, Chicago is comprised of 716 codes with tax rates varying from 6.81 percent of the Equalized Assessed Value, or EAV, to 9.64 percent of EAV in 2014. The Cook County clerk listed 72 taxing districts that levied taxes on properties within Chicago in 2014. In addition, the clerk listed 156 additional taxing districts that did not levy a tax that year. Each composite tax rate had between 10 and 13 taxing districts levying a tax on property owners.21
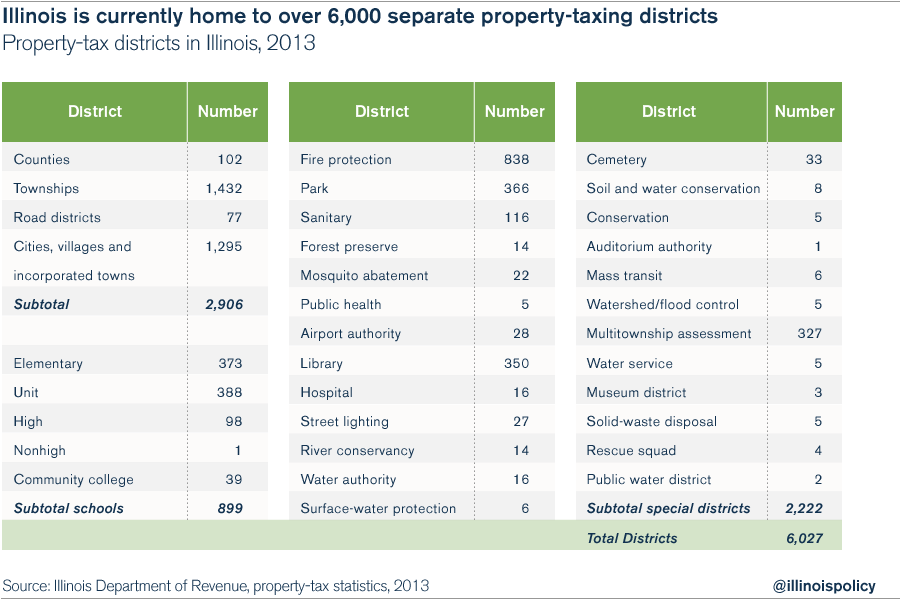
Statewide there were 6,027 property-taxing districts in 2013, consisting of counties, townships, road districts, municipalities, school districts, community colleges and special districts.
The special-districts category is very broad and consists of the following types of districts: fire protection, park, sanitary, forest preserves, mosquito abatement, public health, airport authorities, libraries, hospitals, streetlight, river conservancy, water authority, surface-water protection, cemeteries, soil and water conservation, conservation, watershed and flood control, mass transit, museums, rescue squads, public water, multitownship assessment, solid-waste disposal, water service and even a single auditorium district.22
Historic change in taxing districts
The number of taxing districts in Illinois has not changed much over the past 10 years. In fact, the number of counties, municipalities and road districts has varied little over the last 30 years. The number of schools has decreased by 152 since 1980, and the number of community colleges has remained constant.
However, from 1980 to 2000, 723 new special districts were created. Leading the list were 345 multitownship assessment districts, 228 libraries, 67 parks, 40 sanitary districts and 16 water authorities. Since 2000, the number of special districts has declined by just four.
Thus, the growth in special districts until 2000 contributed to the increasing costs of property taxes. Since 2000, the growth in the number of taxing districts cannot have been a contributing factor; however, the sheer number of taxing districts creates the potential for high property taxes in general because each district participates as part of the composite tax rate, which pushes the total higher.
School vs. nonschool property taxes
The largest share of property taxes supports schools and community colleges. In 2013, school property taxes comprised 63.2 percent of all property-tax extensions, the highest share on record going back to 1968.
Over the past 40 years, from 1973 to 2013, total school property taxes grew at an average annual rate of 5.6 percent, and nonschool property taxes grew at an average annual rate of 5.1 percent. In the meantime, inflation grew only 4.1 percent annually. In 2013, total school property-tax extensions were $17.2 billion, and nonschool property-tax extensions were $10 billion.
School and nonschool growth through the decades
Growth in total property-tax extensions during the 1970s did not keep up with inflation partly because of historically high inflation rates. Total school property-tax extensions grew 61.8 percent with an average annual rate of 4.9 percent, and total nonschool property-tax extensions grew 86.3 percent with an average annual rate of 6.4 percent. However, the consumer price index increased 95.1 percent with an average annual rate of 6.9 percent.23
Nonetheless, growth in total tax extensions exceeded inflation during the following decades and more than made up for the shortfall during the 1970s.
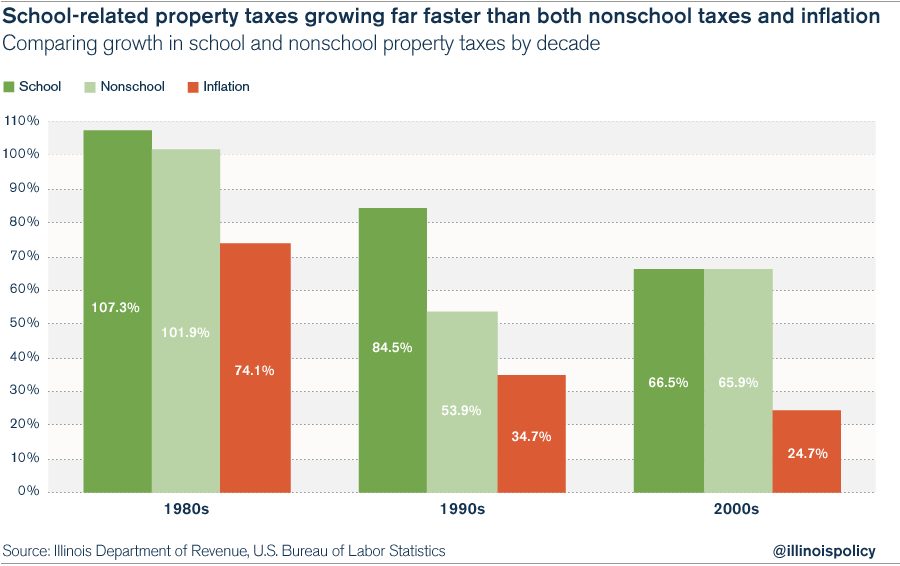
Total school property-tax extensions grew during the 1980s, 1990s and 2000s by 107.3 percent, 84.5 percent and 66.5 percent, respectively. By comparison, the consumer price index increased during those years by 74.1 percent, 34.7 percent and 24.7 percent, respectively.
Total nonschool property-tax extensions grew nearly as rapidly during the 1980s, 1990s and 2000s: 101.9 percent, 53.9 percent and 65.9 percent, respectively. The average annual growth rates for school property taxes were 7.6 percent, 6.3 percent and 5.2 percent for the 1980s, 1990s and 2000s, respectively, and the average annual growth rates for nonschool property taxes during those time periods were 7.3 percent, 4.4 percent and 5.2 percent, respectively.
From 2010 through 2013, total school property-tax extensions grew 9.8 percent compared to a 6.9 percent increase in the consumer price index. Total nonschool property-tax extensions, however, have only grown 3.5 percent over those four years. If growth were to continue at the current annual rates, school property-tax extensions will grow by 26 percent and nonschool extensions by 18 percent for the rest of the decade.
Regional differences in school property-tax growth
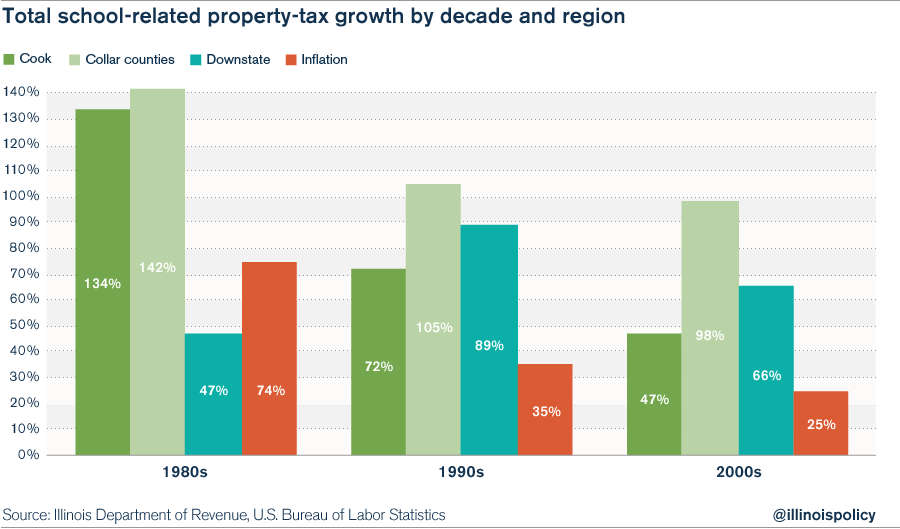
For Cook County, in every decade since the 1980s, total school property-tax extensions exceeded inflation.
• During the 1980s, school property taxes increased 134 percent, compared to 74 percent for inflation.
• During the 1990s, school property taxes increased 71.7 percent, compared to 34.7 percent for inflation.
• During the 2000s school property taxes increased 47.1 percent, compared to 24.7 percent for inflation.
From 2010 through 2013, school property taxes increased 10.5 percent, compared to inflation of 6.9 percent. School property taxes and inflation are on pace to grow 28.4 percent and 18.2 percent, respectively, for the decade.
Total school property-tax extensions for the collar counties – DuPage, Kane, Lake, McHenry and Will counties – grew even more rapidly than those in Cook County.
• During the 1980s, school property taxes increased 141.9 percent, compared to 74 percent for inflation.
• During the 1990s, school property taxes increased 104.7 percent, compared to 34.7 percent for inflation.
• During the 2000s school property taxes increased 98.5 percent, compared to 24.7 percent for inflation.
From 2010 through 2013, school property taxes increased 10.3 percent, compared to inflation of 6.9 percent, which, if extrapolated for the remainder of the decade, would grow 27.8 percent and 18.2 percent, respectively.
For the rest of the state, only during the 1980s did total school property-tax extensions not exceed inflation.
• During the 1980s, school property taxes increased 47.3 percent, compared to74 percent for inflation.
• During the 1990s, school property taxes increased 89.4 percent, compared to 34.7 percent for inflation.
• During the 2000s, school property taxes increased 65.7 percent, compared to 24.7 percent for inflation.
From 2010 through 2013, school property taxes increased 7.9 percent, compared to inflation of 6.9 percent. If allowed to grow at this rate for the remainder of the decade, they would grow 20.8 percent and 9 percent, respectively.
Regional differences in nonschool property-tax growth
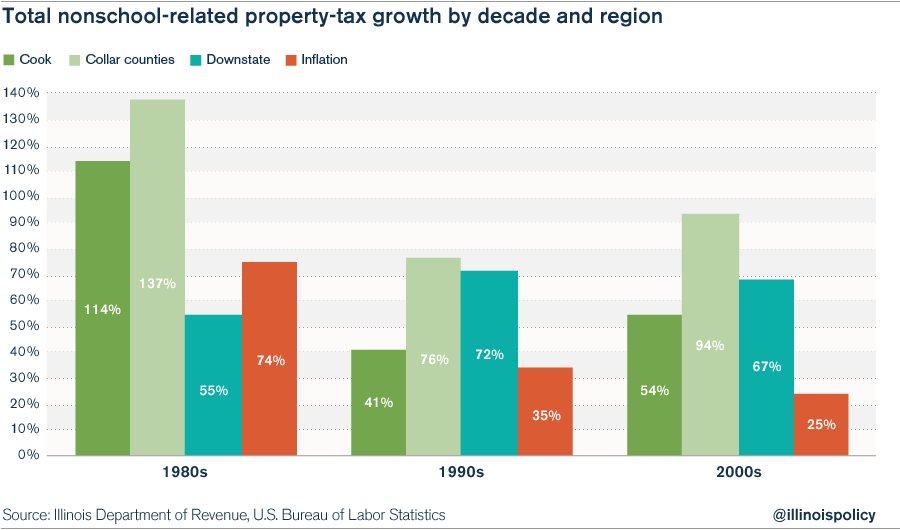
For nonschool property-tax extensions, the story is very similar. In Cook County:
• During the 1980s, nonschool property taxes increased 113.9 percent, compared to 74 percent for inflation.
• During the 1990s, nonschool property taxes increased 40.7 percent, compared to 34.7 percent for inflation.
• During the 2000s, nonschool property taxes increased 54.1 percent, compared to 24.7 percent for inflation.
However, from 2010 through 2013, nonschool property taxes increased 1.6 percent, compared to inflation of 6.9 percent, which would equal 4.0 percent and 18.2 percent for the decade, respectively, if the growth continued at the same rates.
As with school property taxes, total nonschool property-tax extensions for the collar counties grew more rapidly than those in Cook County.
• During the 1980s, nonschool property taxes increased 136.8 percent, compared to 74 percent for inflation.
• During the 1990s, nonschool property taxes increased 76.3 percent, compared to 34.7 percent for inflation.
• During the 2000s, nonschool property taxes increased 93.6 percent, compared to 24.7 percent for inflation.
From 2010 through 2013, school property taxes increased 3.6 percent, compared to inflation of 6.9 percent, which would equal growth of 9.4 percent and 18.2 percent, respectively, for the decade.
Similar to the pattern for school property taxes in the rest of the state, nonschool property-tax-extension growth did not exceed inflation during the 1980s, but did so during the 1990s and 2000s.
• During the 1980s nonschool property taxes increased 54.7 percent, compared to 74 percent for inflation.
• During the 1990s nonschool property taxes increased 71.6 percent, compared to 34.7 percent for inflation.
• During the 2000s nonschool property taxes increased 67.5 percent, compared to 24.7 percent for inflation.
From 2010 through 2013, school property taxes increased 7.5 percent, exceeding inflation of 6.9 percent. These growth rates would yield total growth of 19.8 percent and 18.2 percent for the decade.
In summary, both school and nonschool property taxes have grown faster than inflation, but school property taxes have grown faster. Schools account for 63 percent of all property taxes, and no area of the state – neither Cook County, the collar counties, nor the rest of the state – has been exempt from the high growth in property-tax extensions.
Breaking down Illinois' property taxes: Property taxes by county
Nearly every county in Illinois had a dramatic increase in its tax burden in recent years.
On average, each county’s burden has increased about 32 percent – although, as noted above, the weighted average is 45 percent because some of the more populated counties have seen more dramatic increases. Cook County, for example, had a 63.6 percent increase in its tax burden, and DuPage County had a 51.3 percent increase.
Appendix A shows residential property-tax extensions, households, tax per household, median household income, and the tax-burden indicator for all counties, averaged for the years 2009 to 2013, in 2013 constant dollars. The Appendix compares those measures to the year 2000 using U.S. Census 2000 data and Illinois Department of Revenue data. For statistical reliability reasons, the U.S. Census Bureau makes available only five-year averages for households and median income in smaller populated counties for 2013. Therefore, the residential property-tax extensions for the years 2009 through 2013 were adjusted for inflation and converted to constant 2013 dollars and averaged to match the census data.
Median income varied from $26,972 in Alexander County to $81,765 in Kendall County. Tax-burden indicators varied from 1.2 percent in Gallatin County – which, together with Scott County, was one of only two counties that had decreases in their burdens – to 9.3 percent in Lake County, which had a 44 percent increase in its tax burden. When considering the tax per household, it is important to keep in mind that the actual tax per household is low for many counties because larger apartment complexes are assessed as commercial properties.
Appendix B shows the types of taxing districts for each county, providing information on where property-tax money is going.
Appendix C shows property-tax extensions by class and county. Statewide residential properties account for 64.4 percent of extensions, but this number varies by county. For example, residential properties account for only 21 percent of extensions in Jasper County, but 80 percent in Kendall County.
Farm extensions are 3 percent statewide, but vary from 0 percent in Cook County to 56 percent in Stark County. Commercial properties averaged 22.5 percent statewide, but vary from 2 percent in Pope County to 33 percent in Champaign County. Industrial properties averaged 9.2 percent statewide, but vary from 0 percent in Calhoun, Cass, Henderson, Johnson and Pope counties to 41 percent for Crawford County.
The limited effects of the property tax extension limitation law and tax increment financing districts
The Property Tax Extension Limitation Law
In recognition of the state’s growing tax burden, Illinois lawmakers enacted the Property Tax Extension Limitation Law, or PTELL, in 1991 to slow the growth in property taxes.
Originally PTELL only applied to nonhome-rule24 taxing districts in the collar counties – DuPage, Kane, Lake, McHenry and Will. Nonhome-rule taxing districts in Cook County were added in 1995. Additionally, the remaining counties were authorized to hold referendums to adopt PTELL for their own counties in 1996.25 In 2013, there were taxing districts in 39 counties subject to PTELL, meaning that 63 counties were not subject to PTELL.26
For the local government units subject to PTELL, the law limits tax increases for the aggregate levy of property-tax extensions to the lesser of the U.S. consumer price index or 5 percent. However, the cap is applied only at the aggregate level, and individual taxpayers may see their taxes grow in excess of those limitations.
Moreover, the limitation has notable exceptions. As already indicated, the law only applies to nonhome-rule taxing districts, and there are 209 home-rule municipalities. Second, the law does not apply to all extensions and voter-approved rate increases. For example, special taxing districts and certain bonds are exempt.
Despite these limitations, property taxes would have been higher without PTELL. In 2013, property taxes in those 39 counties were 2.9 percent lower than what they would have been, which saved the taxpayers in those taxing districts $657.4 million. However, taxes still went up for those counties by 2.8 percent or $308 million. Because of PTELL’s limited application, total property taxes for the state are still increasing above acceptable rates of growth.27
Tax increment financing districts
The extension data used in this analysis includes taxes for 1,160 tax increment financing, or TIF, districts. Property-tax collections for TIF districts have grown to $1 billion in 2013, from $200 million in 1994, accounting for 3.7 percent of all property-tax extensions. TIF-district total extensions peaked in 2008 with $1.23 billion in property-tax extensions.28
Theoretically, TIF districts should not increase property-tax burdens, nor should they take revenue away from taxing districts. TIF is an economic-development tool that purportedly creates additional tax revenue and only captures the additional or incremental revenue due to the economic-development activity that would not have happened otherwise.
However, if the basic assumption is wrong, and the economic activity would have occurred anyway, then the TIF district would indeed divert revenue away from the current taxing districts, thus preventing a mitigation of or lowering of property taxes on everyone else. Further study is needed to determine the degree to which TIFs have contributed to the increased tax burden.
Conclusion
Illinois has experienced massive growth in property taxes over the past several decades. This growth has far exceeded the growth of population, inflation and the economy.
Illinois homeowners face an increasingly unaffordable burden from property taxes. When measured against median household income, Illinoisans’ residential property-tax burden is 76 percent higher in 2013 than it was in 1990.
And the state’s increasingly burdensome property taxes are not due to an attempt to keep other taxes low. Instead, property taxes are just one of the many high taxes Illinoisans face. As a result, Illinois has the ninth-highest state and local tax burden per capita, and the 13th-highest burden as a percentage of income.
Due to the burden that property taxes already place on Illinoisans, the state must take steps beyond just moderating the growth in property taxes, as PTELL attempts to accomplish.
Instead, Illinois should reduce the overall burden of property taxes to make them more affordable for average homeowners and to bring Illinois’ effective rates in line with those of other states.
A universal property-tax freeze would achieve that goal over time.
Additional steps to reduce the burden of property taxes include reducing the number of taxing districts and requiring taxing districts to implement financial plans to deliver services at lower costs.
By consolidating some taxing districts, overhead will be reduced, the number of highly paid executives and staff will be streamlined, and the overall burden borne by taxpayers will become more transparent.
Consolidation, therefore, will go a long way toward bringing down property-tax costs.
In addition, the General Assembly should consider requiring each district that levies property taxes to submit financial and implementation plans regarding how it will operate more efficiently by providing necessary services at lower costs. These plans will help bring greater transparency and accountability to the system.