Illinois is suffering from an out-migration crisis, and millennials are leading the exodus. On a national scale, Illinois is the second-biggest net loser of both millennial taxpayers and their dependents, and millennial college students. Illinois’ youth out-migration problem threatens the state’s long-term financial stability and economic vitality.
Illinois’ out-migration trend has worsened in recent years, helping to catapult Illinois into three consecutive years of population decline. A long-standing theory claims Midwestern states like Illinois lose population largely because of retirees moving to Sun Belt states.1,2 Illinois’ out-migration plight, however, is unique in the Midwest. Official government data show Illinois is losing more people, on net, to out-migration than any other state regionally, and half of Illinois’ out-migration losses in 2015 went to other Midwestern states, rather than the Sun Belt.3 Even after adjusting for population size, the Illinois exodus is still much worse than the out-migration experienced in surrounding states.4 That theory also ignores the fact that millennials, not retirees, are at the forefront of the Illinois exodus. Illinois has a youth problem that demands attention from Illinois policymakers, given the long-term impact millennial out-migration will have on the state, as well as the generational inequity that comes with Illinois’ tremendous pension debt.
Even though some suggest that Illinois’ mass youth departure is a recent phenomenon the ongoing budget impasse and government stalemate brought about, official government data are not yet available for the years of the budget impasse, so it is impossible to determine how youth out-migration has been affected.5 Nevertheless, a youth flight has clearly been underway in Illinois since at least 2011, with millennial college students heading out of Illinois since at least the start of the 21st century.
Millennial taxpayers and their dependents, or those age 34 and under, made up 32 percent of Illinois’ net migration losses to other states – more than any other age cohort – between the 2011-2012 and 2014- 2015 tax years, according to the four years of available data from the Internal Revenue Service. Illinois has also experienced a chronic net loss of millennial college students since at least 2000, according to data from the National Center for Education Statistics, or NCES. Illinois’ youth problem is far worse than average. In fact, Illinois ranked second-worst nationally on both net losses of millennial taxpayers and their dependents (2011-2012 through 2014-2015) and net losses of millennial college-bound students (2000- 2014) to other states, according to IRS and NCES data. Illinois lost, on net, as many as 148,000 millennials – including millennial taxpayers and their dependents and millennial college students – between the years of 2011 and 2014 alone. Millennial migration shows that millennials believe they are better off in other states, and their demonstrated propensity to put down roots elsewhere threatens Illinois’ long-term stability and economic prospects.
Introduction
Interstate migration, or domestic migration, refers to the flow of residents between U.S. states.6 By tracking who is moving where, interstate migration data show which states are gaining and which are losing net population with respect to other states. State-to-state moving patterns are an effective way to map a state’s general appeal over time. A state’s popularity is fluid because any number of factors – such as weather, jobs, affordability, policies, politics, crime and lifestyle preferences – can change and shift the tide of interstate migration over time. Therefore, prolonged trends are better measures of a state’s overall pull than any given year on its own. In addition, while sheer net gains and losses provide a valuable baseline, the composition of the moving crowds is crucial to understanding which variables might be driving state-to-state migration. This information is also helpful in predicting future trends.
Millennial migration is worth studying because of millennials’ mobility and their long-term economic impact. The millennial generation is composed of young working-age adults and students, and it amounts to the most mobile age cohort, with 35-to-44-year-olds also among the most itinerant. This is likely because millennials are less encumbered than their older and more established counterparts, and thus more able and willing to move to other states. Further, millennials surpassed members of Generation X (those following the 1946-1964 baby boom generation) to make up the largest share of the U.S. workforce in 2015, according to the Pew Research Center.7 They accounted for more than 1 in 3 American workers in 2015,8 and are expected to make up 75 percent of the workforce by 2025.9 As millennials climb career ladders and increasingly dominate the labor force, they take on an increasingly central role in local, national and international economies.
Millennial moving patterns shed some light on the state-of-residence preferences of the up-and-coming generation, which will be sure to affect interstate migration flows and population trends for decades. Residence and migration data show there are clear winners and losers when it comes to attracting and retaining millennials – and Illinois is being left in the dust. However, given Illinois’ financial struggles, the state will need to keep its share of this demographic to ensure its future.
Millennials’ role in Illinois’ out-migration crisis
Illinois is suffering from an out-migration crisis as Illinoisans continue to move to other states in droves. According to in flows and out flows of exemptions led with the IRS, Illinois lost roughly 252,000 taxpaying residents and their dependents, on net, to out-migration over the four tax years between 2011-2012 and 2014-2015 alone. A loss of that magnitude is commensurate with the combined populations of Springfield, Ill., and Peoria, Ill., – and then some – heading for the state’s borders. Millennial taxpayers and their dependents, or those age 34 and under, made up more than 81,000 of those net losses – equivalent to the entire population of Champaign, Ill. Many college-bound millennials are likely not reflected in the millennial age brackets of the IRS data,10 but they are also part of the millennial out-migration equation. In fact, Illinois lost an estimated 13,000 millennial college students, on net, per year from 2000 through 2014, according to NCES data.
Illinois’ out-migration problem reached “crisis” proportions once natural increases11 and international migration gains did not offset the vast number of residents moving from Illinois to other states, causing the state’s population to shrink for three years in a row.12 Illinois’ population has historically grown despite net domestic migration losses, because natural increases and international migration gains were enough to offset Illinois’ losses to other states. Illinois’ natural population growth rate, however, can no longer keep pace with the accelerating rate of out-migration.
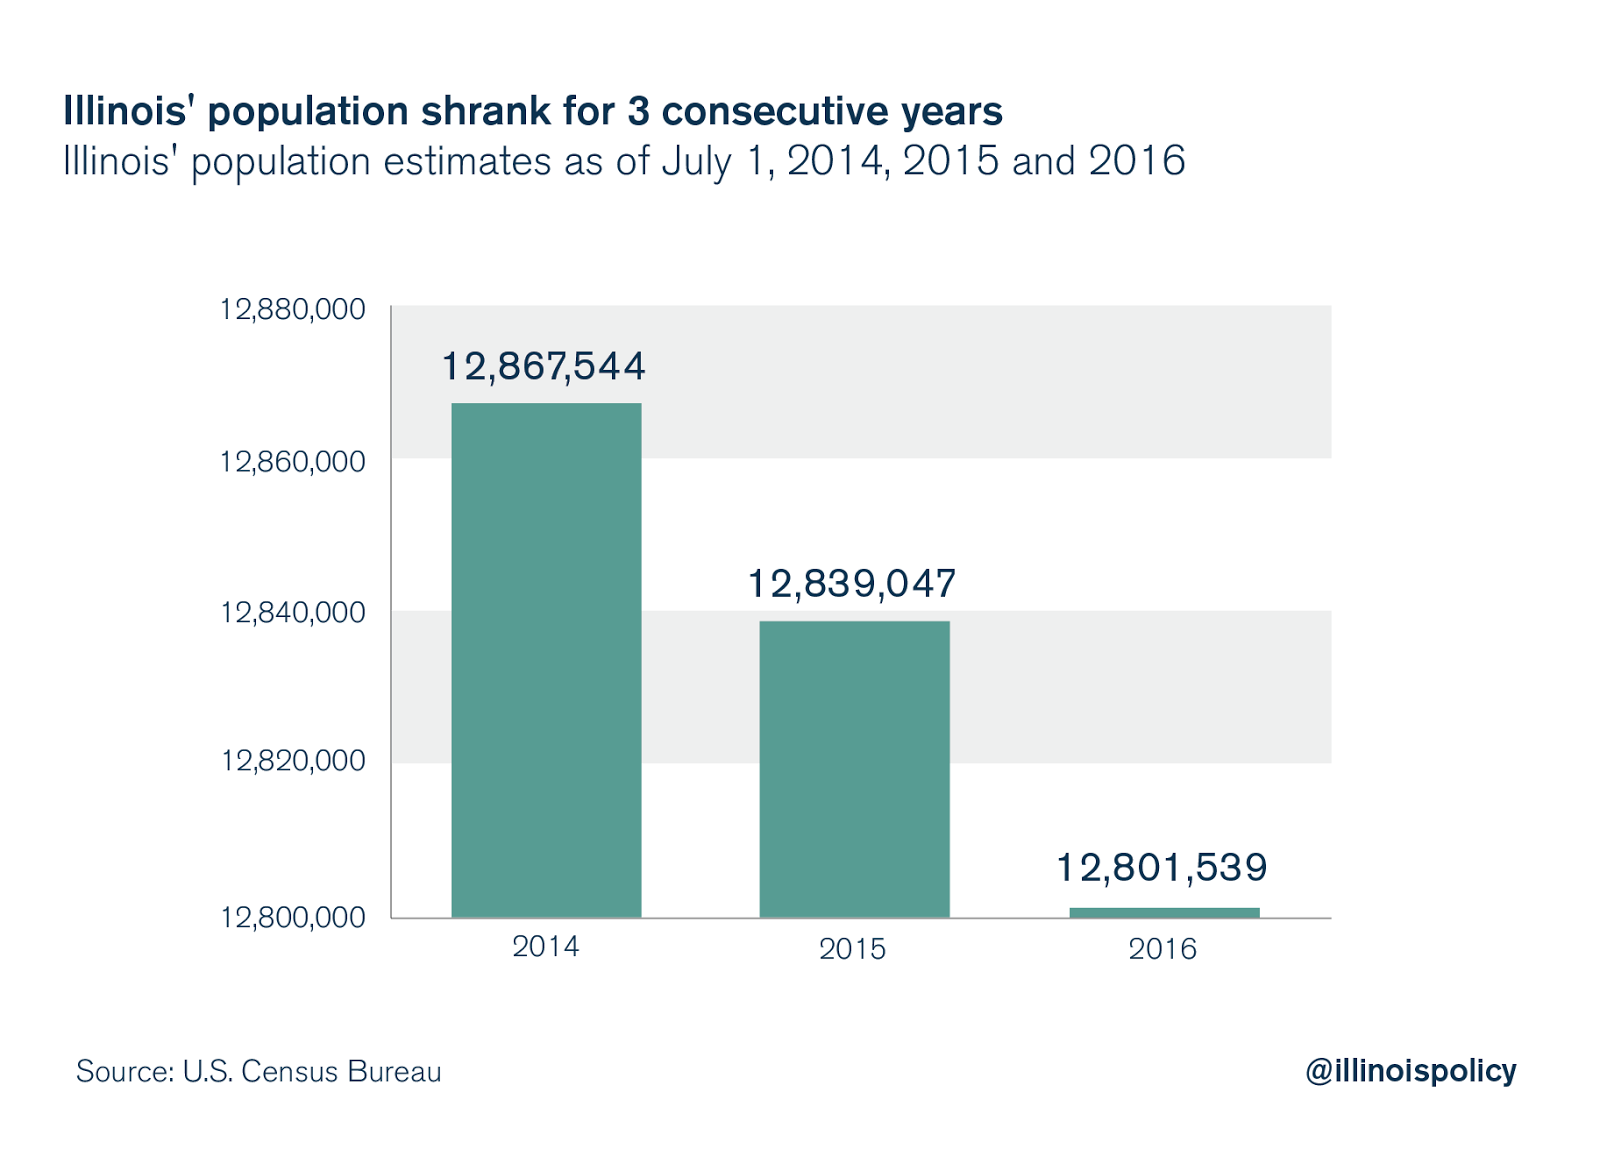
The out-migration plight afflicting Illinois is unparalleled in neighboring states. As of July 2016, Illinois’ population was the only one in the region to shrink, for the third consecutive year.13 Illinois shrank by more people than any other U.S. state from July 2015 through July 2016, losing more than 114,000 residents, on net, to interstate migration and reporting a population decline of almost 38,000, according to the U.S. Census Bureau.14 Illinois’ net migration loss from July 2015 through July 2016 was equivalent to the state losing one resident every 4.6 minutes15 – down from one resident every five minutes a year prior.16
Breaking down Illinois’ out-migration numbers paints an even more troubling picture. Over the period comprising the four tax years from 2011-2012 through 2014-2015, more people moved out of than into Illinois across all age brackets, according to IRS data. Millennial taxpayers and their dependents, however, made up the largest net loss to out-migration by age cohort.17 A 2016 poll by the Paul Simon Public Policy Institute found that nearly half – 47 percent – of Illinoisans want to leave the state.18 That number was even higher among millennials, with 57 percent wanting to leave. The data reveal that they are following through, and the mass out-migration of this young generation with substantial economic clout will have long-lasting ramifications for those left behind in Illinois.
The scope of the youth problem
Illinois lost 81,000 millennial taxpayers and their dependents to other states in just four years
Yearly state-to-state migration data from the IRS19 disclose numbers of people moving into and out of the various states, along with their income levels, which allows for analysis of where the income-earning power is going. In 2011, the agency began including age brackets in migration reports, allowing for analysis of migration patterns by age. There is a relatively small pool of data, given that age brackets have only been included for the past four years of data; nonetheless, based on the in flows and out flows of exemptions led with the IRS, the available data reveal that Illinois is unpopular with millennials.
Exemptions appear in the IRS data according to the age of the taxpayer, so millennial taxpayers and their dependents are both reflected in the under-26 and 26-to-34-year-old age brackets. Millennials who remain dependents on their parents’ tax returns would appear as exemptions in older age cohorts corresponding with their parents’ ages. Thus, many college students are likely not reflected as millennials or net losses, if their parents remain in Illinois while the students attend college. Only those millennial college students who led taxes in Illinois, and then led taxes the next year in their new states would be reflected as net losses under the millennial age brackets.
Between the 2011-2012 and 2014-2015 tax years, 361,000 millennial taxpayers and their dependents moved into Illinois, while 442,000 moved out. This net out-migration caused Illinois to lose a net total of 81,000 millennial taxpayers and their dependents.
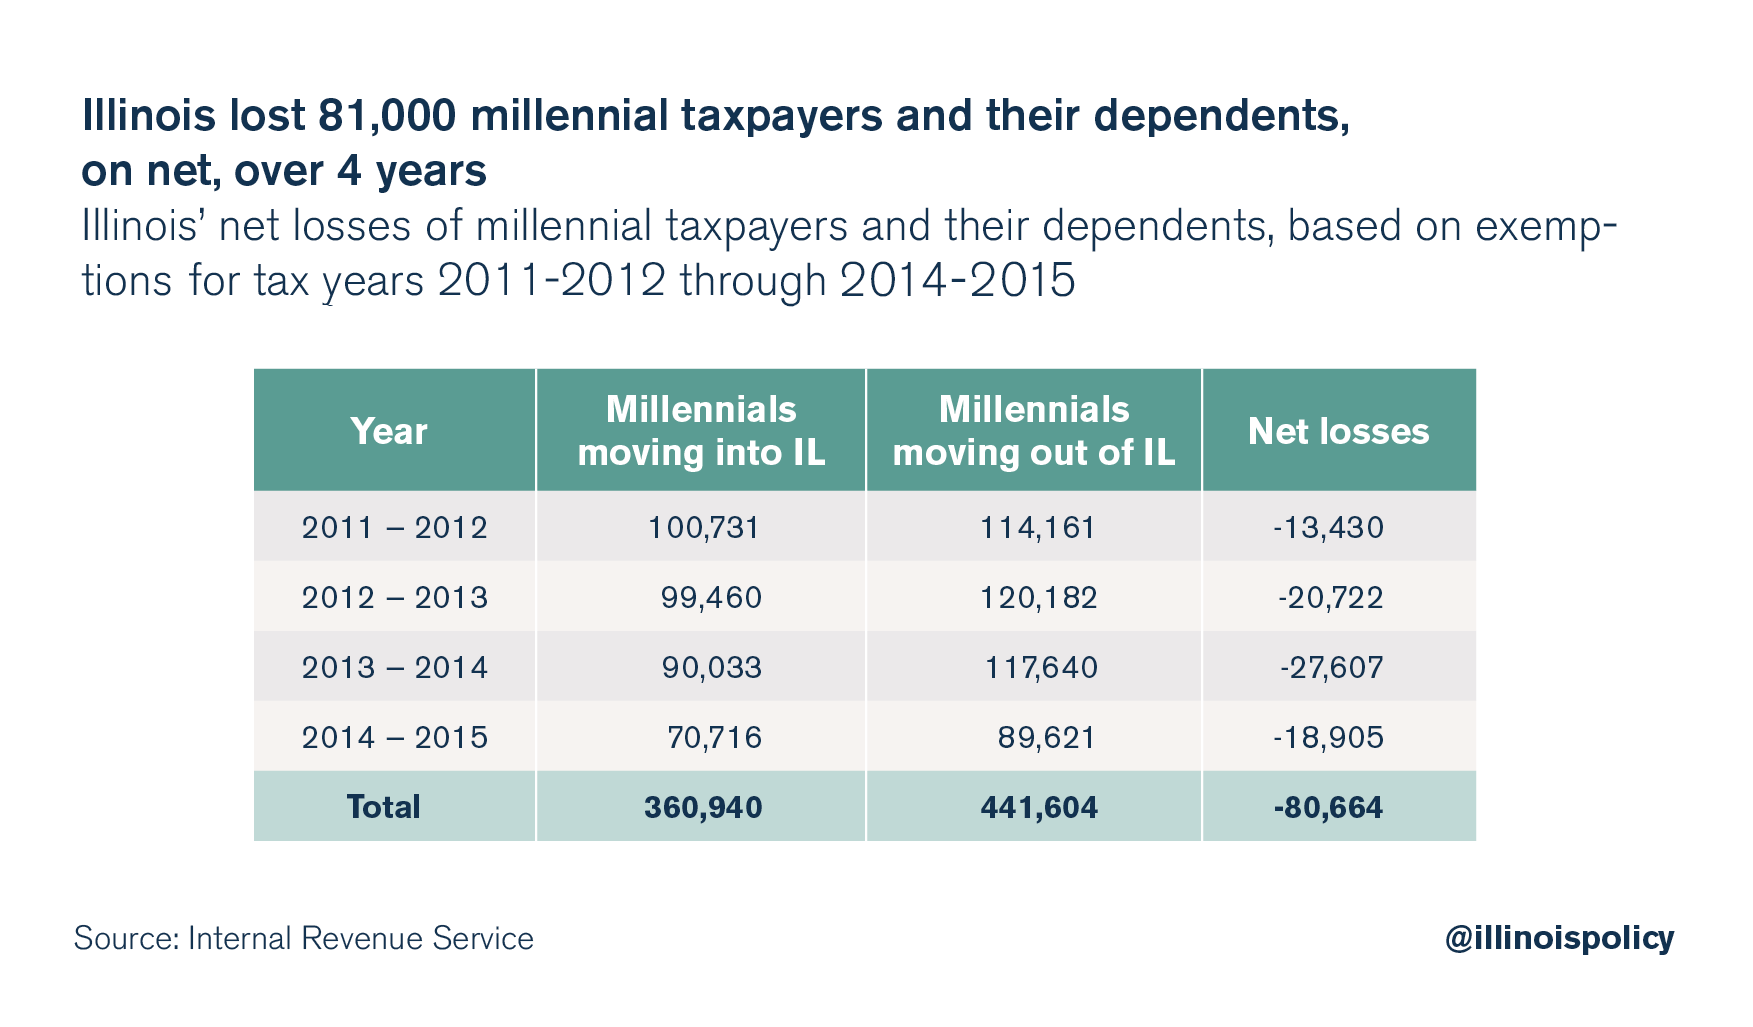
The differential between inbound and outbound millennial taxpayers and their dependents worsened by roughly 7,000 each year between the 2011-2012 and 2013-2014 tax years. However in the 2014-2015 tax year, almost 9,000 fewer millennial taxpayers and their dependents left Illinois, on net, than in the previous year. Specifically, Illinois lost, on net, 13,000 millennial taxpayers and their dependents in 2011- 2012; 21,000 in 2012-2013; 28,000 in 2013-2014 and 19,000 in 2014-2015.
Illinois lost millennial taxpayers and their dependents, on net, over each of the four tax years, suffering an average yearly net loss of about 20,000 millennial taxpayers and their dependents – a net loss more than twice the population size of Rochelle, Ill. Illinois’ net loss of millennial taxpayers and their dependents over this period was second-worst nationally, behind only New York. Due to the fact that age brackets are only available in the data for these four tax years, it is impossible to tell yet whether the millennial out-migration trend has increased, declined or flatlined since tax year 2014-2015. Nevertheless, the sheer number of millennials opting out of Illinois is cause for concern.
Millennial students are moving out of Illinois for college
Higher education student migration patterns provide additional insight into Illinois’ youth problem. There is a relatively larger pool of college-bound student migration data, which complement and further expand upon the four most recent years of IRS data in which college students may not be reflected.
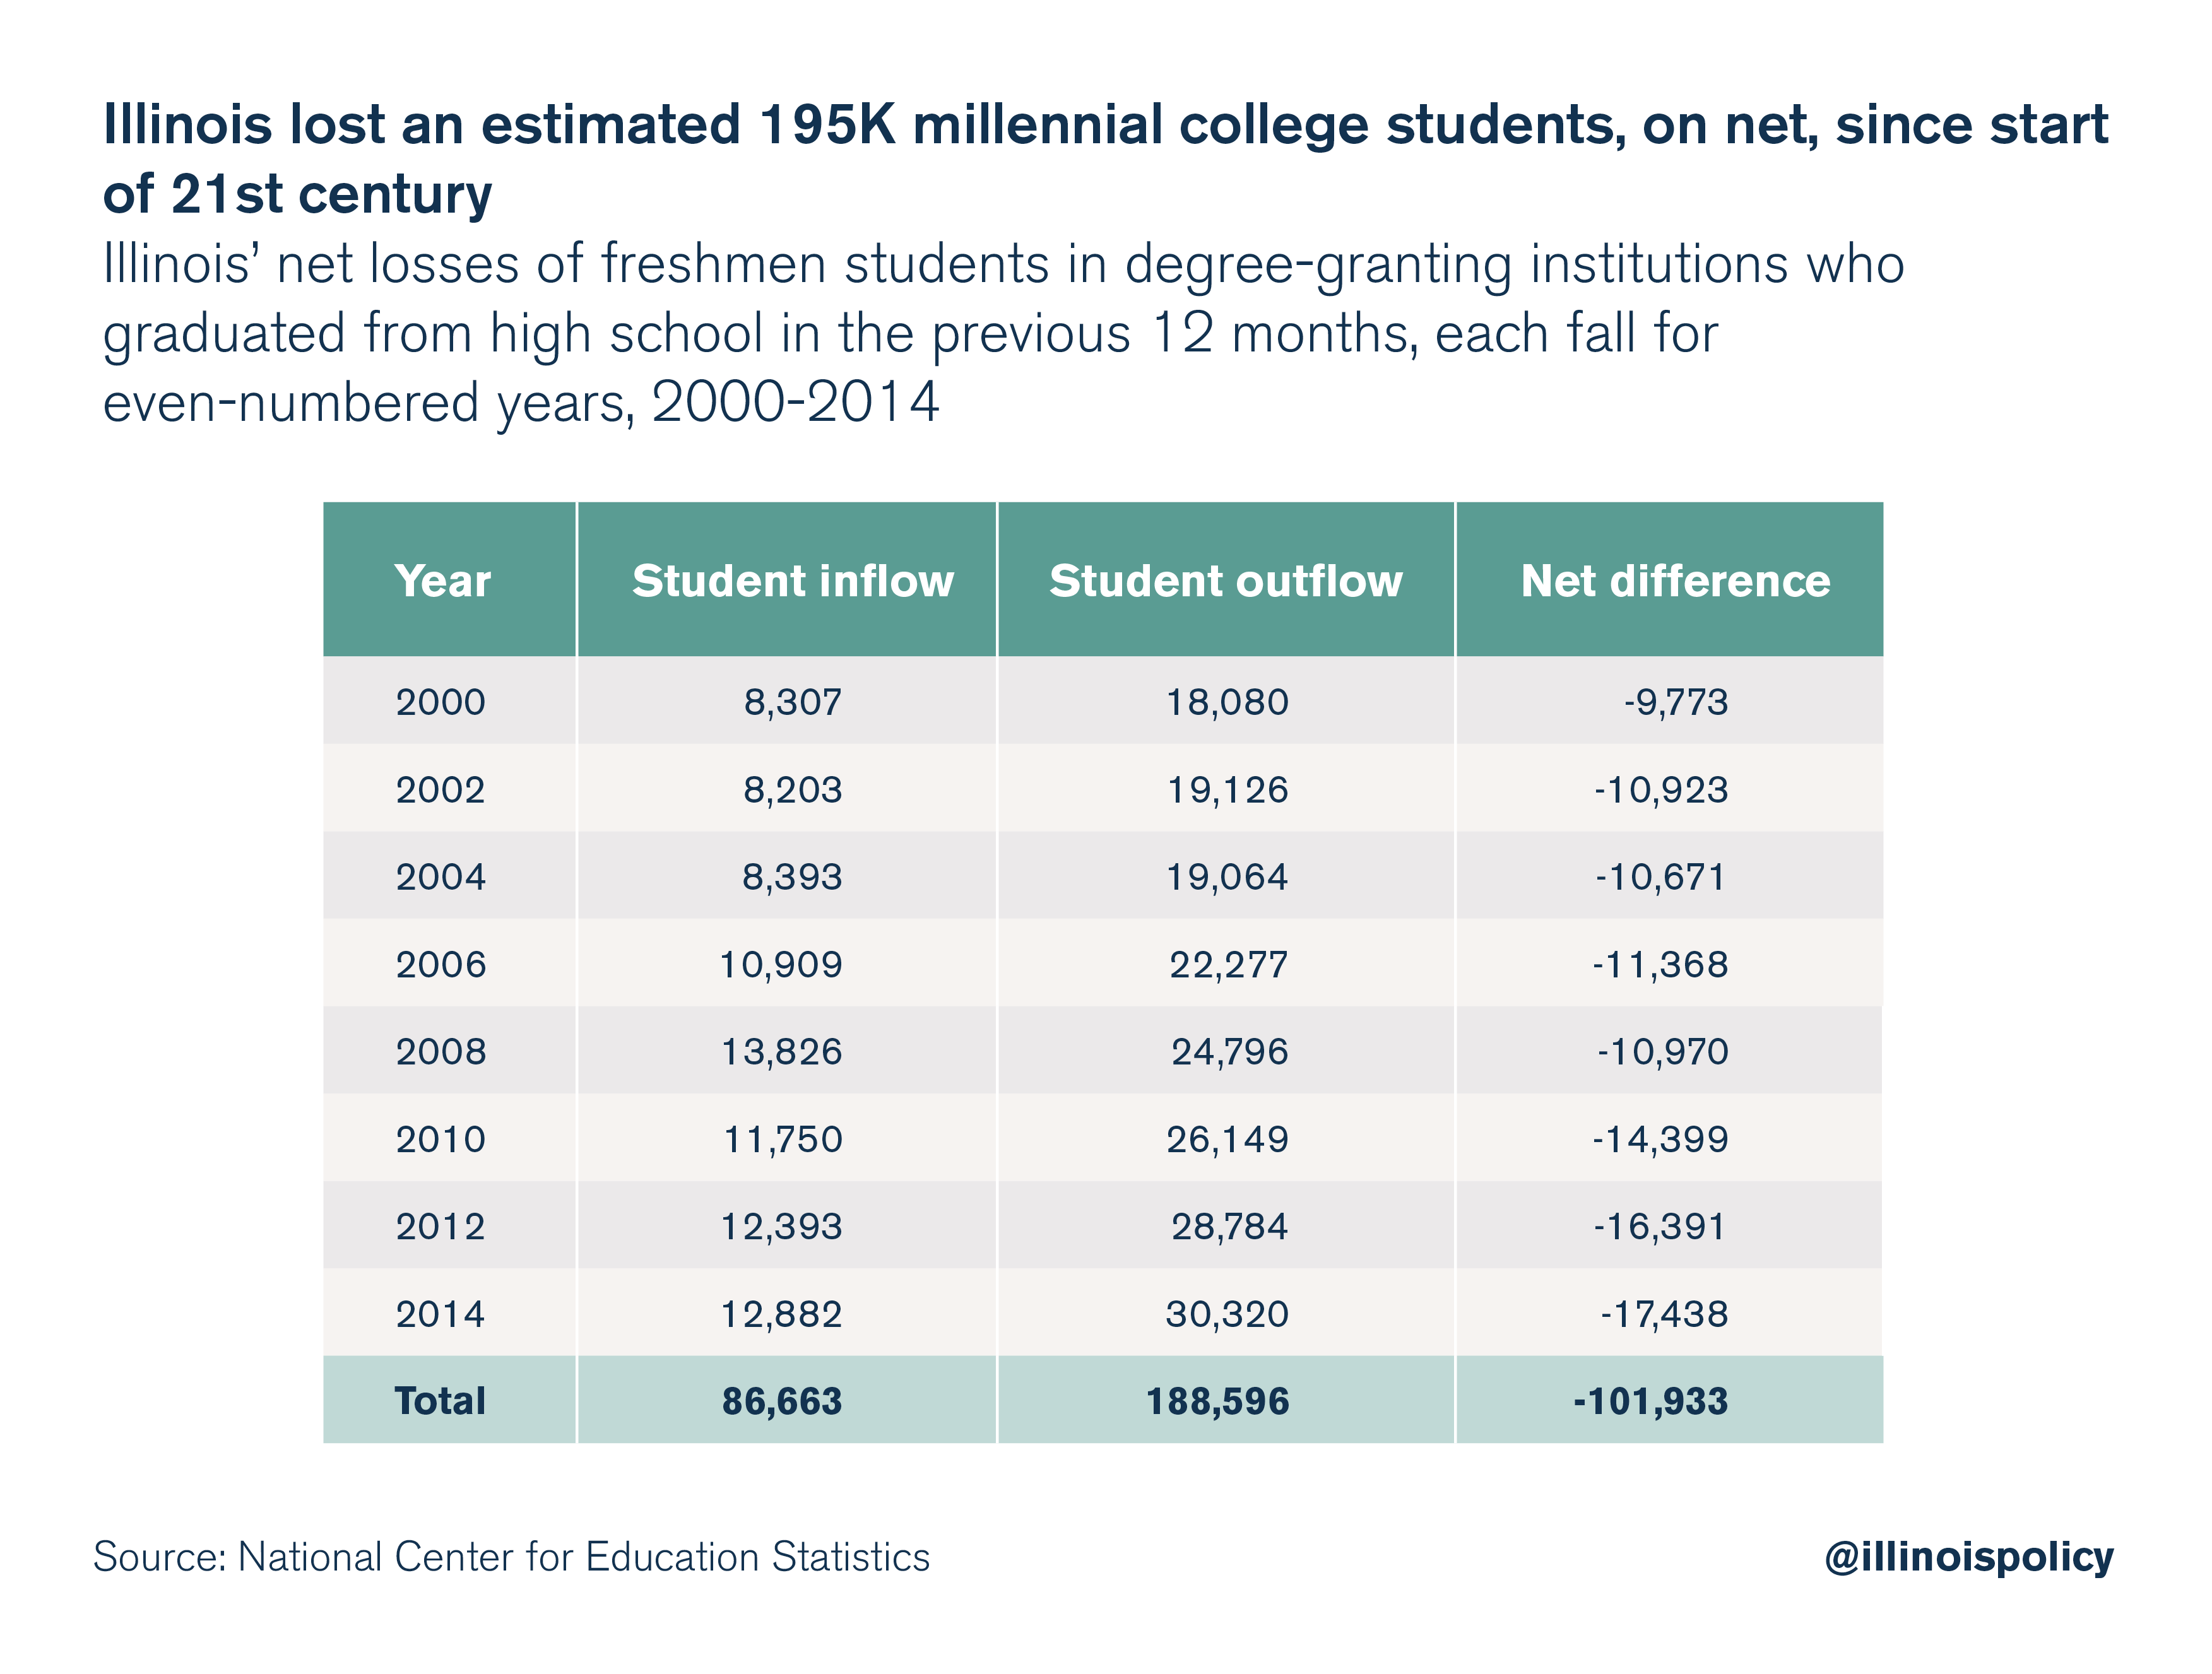
Illinois lost an estimated 195,000 college-bound millennial students to other states, on net, from 2000 through 2014, according to higher education student migration data from the NCES.20 Illinois ranked second-worst in the nation, this time behind New Jersey, on net losses of millennial college students to other states. The data report the residence and migration of all freshmen students in degree-granting institutions who graduated from high school in the past 12 months, by state, for even-numbered years.
Over the eight even-numbered years alone, Illinois suffered a net loss of 102,000 millennial college students from 2000 through 2014. The average yearly net loss of millennial college-bound students from 2000 through 2014 was 13,000. Based on this average, Illinois lost an estimated 195,000 millennial college students to other states, on net, over the entire 15-year period. However, Illinois’ loss rate seems to be accelerating: By 2012, Illinois’ yearly millennial-college-student net loss had creeped above 16,000, and in 2014, it exceeded 17,000.
Illinois suffered a net loss of about 10,000 millennial college students in 2000, compared with roughly 17,000 in 2014. The annual net loss climbed by more than 70 percent over the 15-year period. The average yearly net loss of millennial college students over the four-year period covered by the IRS data (from 2011 through 2014) was almost 17,000, based on an average of the four years, including implied net losses for years 2011 and 2013.21
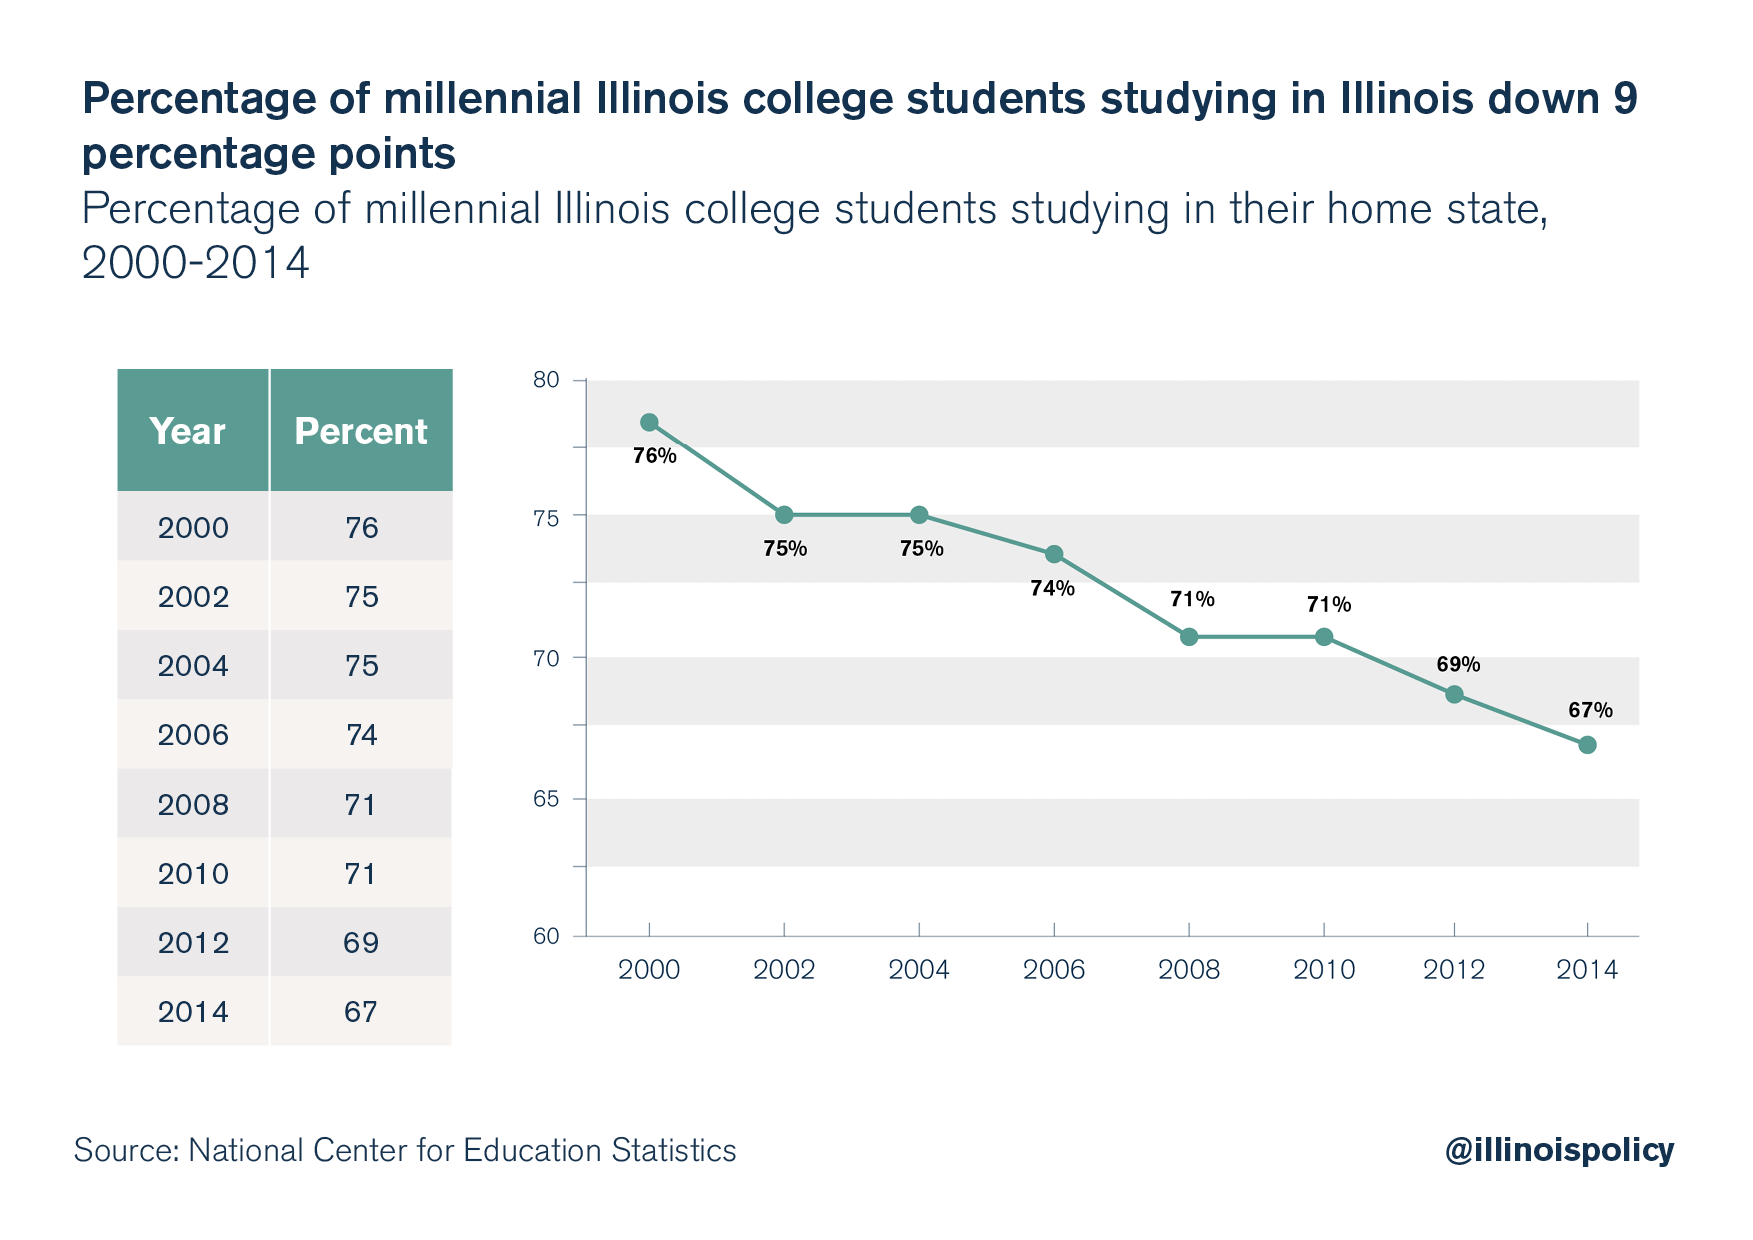
Moreover, the percentage of Illinois’ millennial higher education students studying in Illinois has decreased by 9 percentage points over the 15-year period, steadily dropping to 67 percent in 2014 from 76 percent in 2000.
The NCES data alone do not necessarily indicate youth flight, because students could always return to Illinois upon graduating from college. Together with the IRS information, however, the NCES data paint a much clearer picture. The IRS data show that even if Illinois is regaining all the millennial college students the state is losing – which is doubtful – the state is still losing a greater number of taxpaying millennials and their dependents than those returning. This has resulted in the net loss of millennial taxpayers and their dependents.
Student migration data may be more a manifestation of the health, capacity and affordability of a state’s university system than anything else. However, these factors are often closely tied to state policies. Nonetheless, students choose to study out of state for many reasons, such as to establish independence, to follow friends, geographic location, quality of education, sports programs, scholarships and financial aid accessibility. It is impossible to ascertain why students are choosing other states over Illinois, on net – which leaves only conjecture. Chicago Mayor Rahm Emanuel recently blamed Gov. Bruce Rauner and the ongoing budget impasse22 for the loss of students; however, the trend long precedes the current administration, and official government student migration data are not yet available for the years of Rauner’s tenure. Thus, it is impossible to measure the effect, if any, of the budget impasse on student out-migration at this time.
The systemic and growing student out-migration is likely caused in part by soaring tuition rates in Illinois, which have risen as much as 100 percent over the past decade.23 At the same time, the state has redirected public funds away from the classroom and toward rising pension and administrative costs.24 Illinois’ tuition rates far outpace those of its neighboring states. For instance, in-state tuition and fees cost roughly $16,000 per year at the University of Illinois at Urbana-Champaign,25 $10,000 at the University of Wisconsin – Madison,26 $14,000 at the University of Michigan,27 $10,000 at Indiana University Bloomington,28 $11,000 at the University of Kentucky,29 $8,000 at the University of Iowa30 and $10,000 at the University of Missouri-Columbia.31 Illinois students could apply for programs such as the Midwest Student Exchange Program, in which participating “public institutions agree to charge students no more than 150 percent of the in-state resident tuition rate for specific programs.”32 Under that program, an Illinois student could attend several of the above out-of-state universities, assuming the university participates in the program, for a lower cost than if she were to attend the University of Illinois at Urbana-Champaign – while also dodging Illinois’ fiscal uncertainty.
Regardless of whether these factors are indeed driving Illinois’ rising millennial higher education student net losses, passing a balanced budget,33 as well as fixing administrative bloat and swelling pension costs in public universities,34 would help to minimize both monetary uncertainty and continuous tuition hikes. This would improve Illinois’ standing with students.
Total net millennial losses
Over the course of the four years from 2011 through 2014, Illinois suffered a total net loss of as many as 148,000 millennials, including taxpayers and dependents, and college-bound students. That loss is nearly equal to the population of Rockford, Ill., one of the state’s five largest cities.
Illinois suffered a combined net loss of as many as 37,000 millennial taxpayers and their dependents and students each year from 2011 through 2014. That figure is based on the average yearly net loss of 20,000 millennial taxpayers and their dependents based on the IRS data, and the average yearly net loss of 17,000 millennial college-bound students based on the NCES data over that same period. Over those four years, that estimated 37,000 yearly net loss amounts to a total net loss of as many as 148,000 millennials.
The estimation is imperfect because some millennials could have been counted twice: as both exemptions in the IRS data, and as students in the NCES data if they led taxes in Illinois before leaving for college, and then led taxes in the state where they attended college. Nonetheless, the estimation still provides an approximation of the scope of Illinois’ youth flight.
How does Illinois stack up?
Millennial taxpayers and dependents
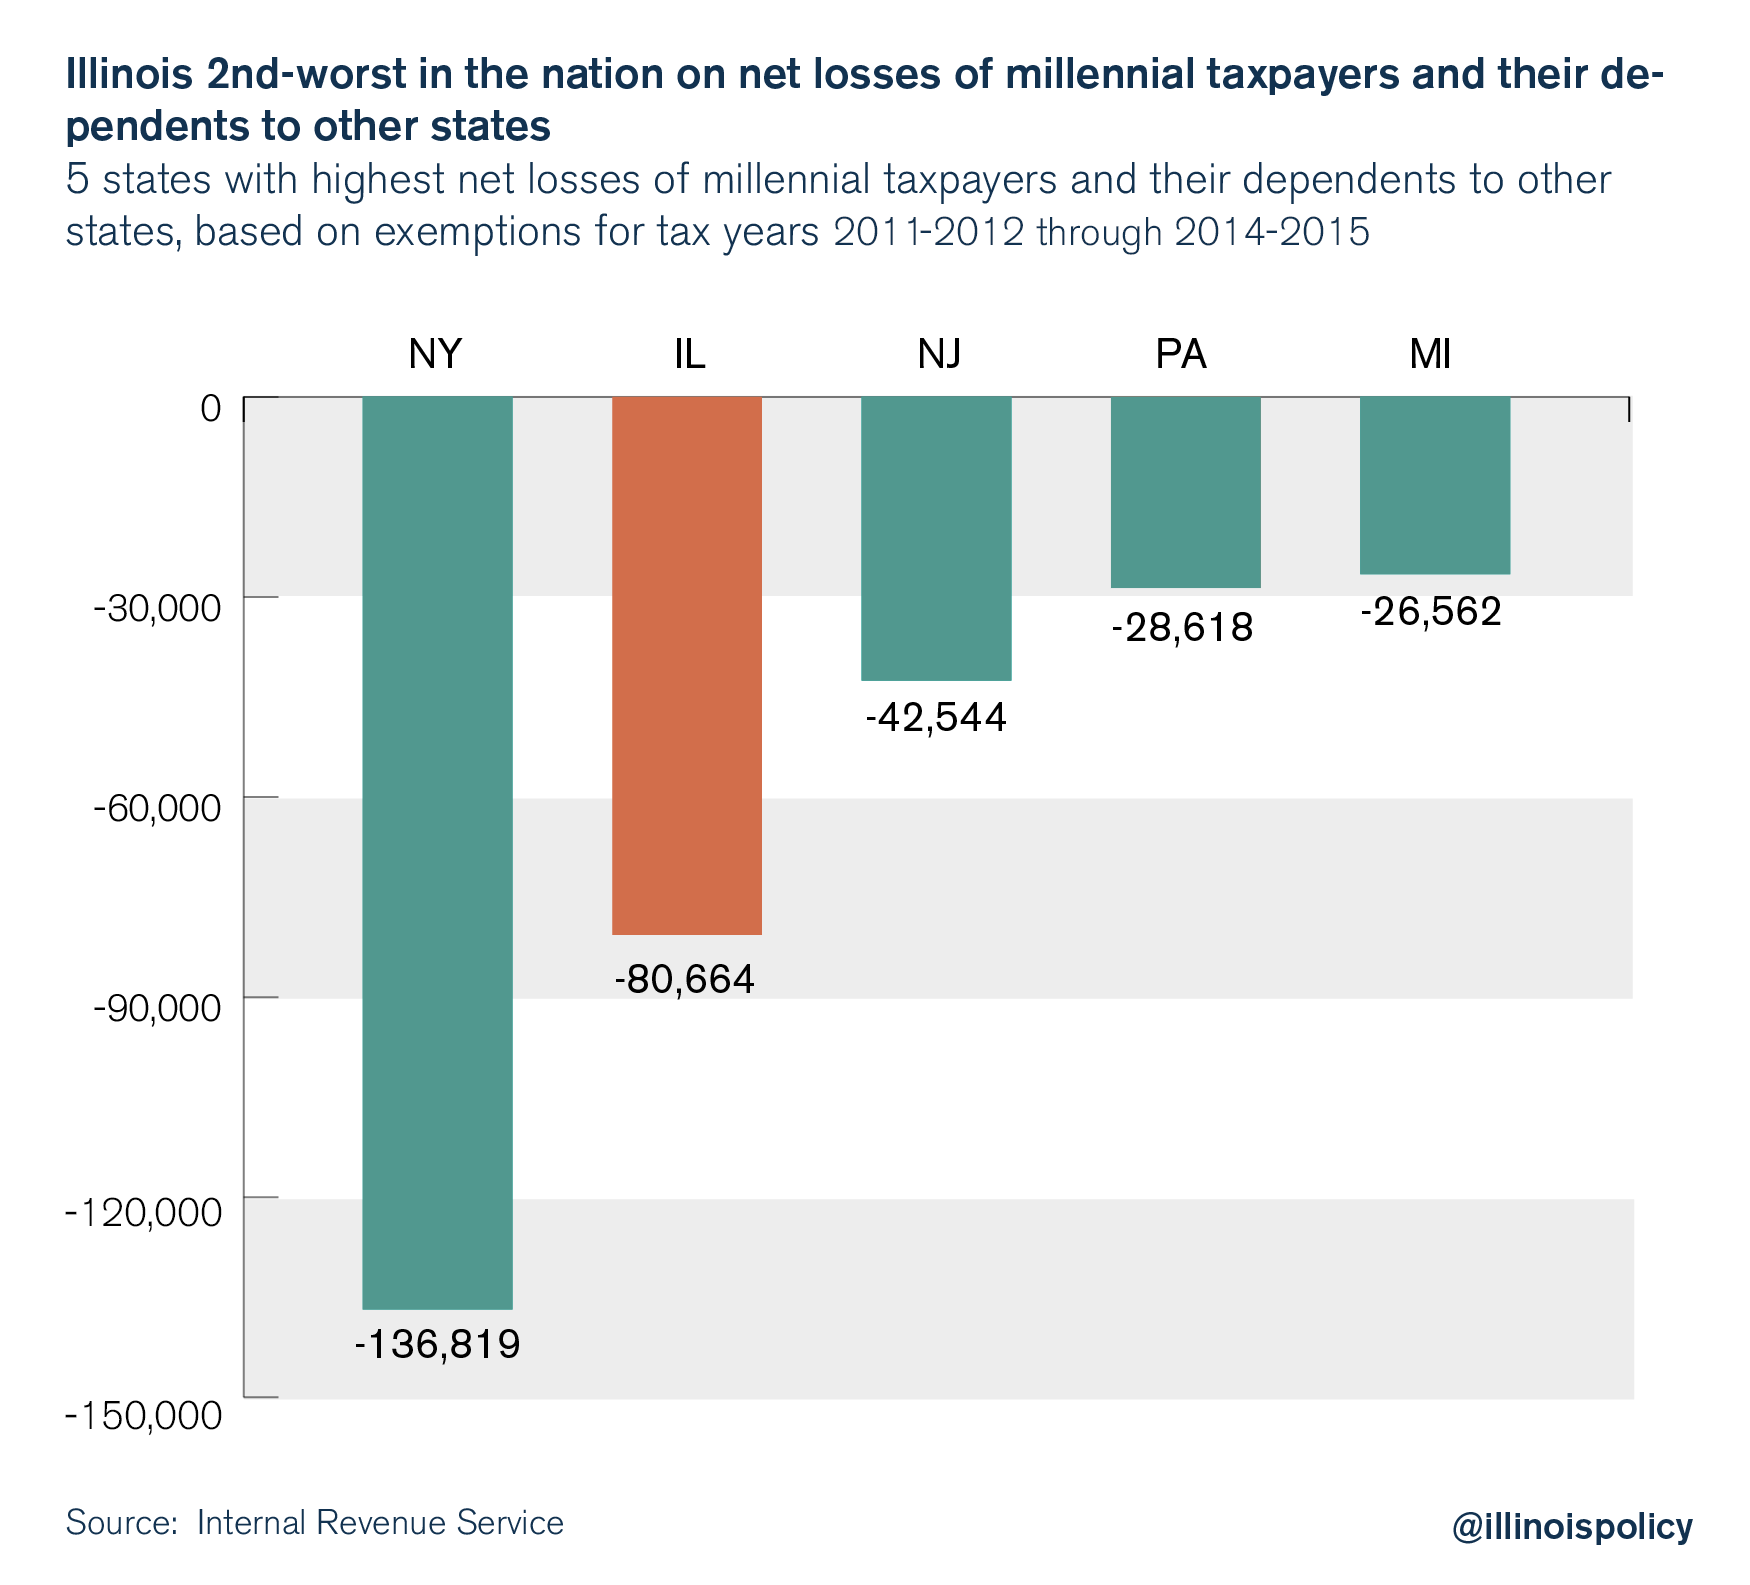
For the four tax years from 2011-2012 through 2014-2015, Illinois’ net loss of 81,000 millennial taxpayers and their dependents ranked second-worst in the nation behind New York’s 137,000 net loss. Even as a percentage of total state population, Illinois four-year net loss still ranked among the top five worst states nationally.
Thirty-two states suffered net losses of millennial taxpayers and their dependents, while 18 states and the District of Columbia experienced net gains in their populations of millennial taxpayers and their dependents. Based on IRS exemptions, the five states losing the most millennial taxpayers and their dependents, on net, to out-migration over this four-year period were New York at -137,000, Illinois at -81,000, New Jersey at -43,000, Pennsylvania at -29,000 and Michigan at -27,000.
The five states that gained the most millennial taxpayers and their dependents, on net, were Texas at 275,000, Colorado at 71,000, Washington at 58,000, Oregon at 24,000 and Tennessee at 23,000.
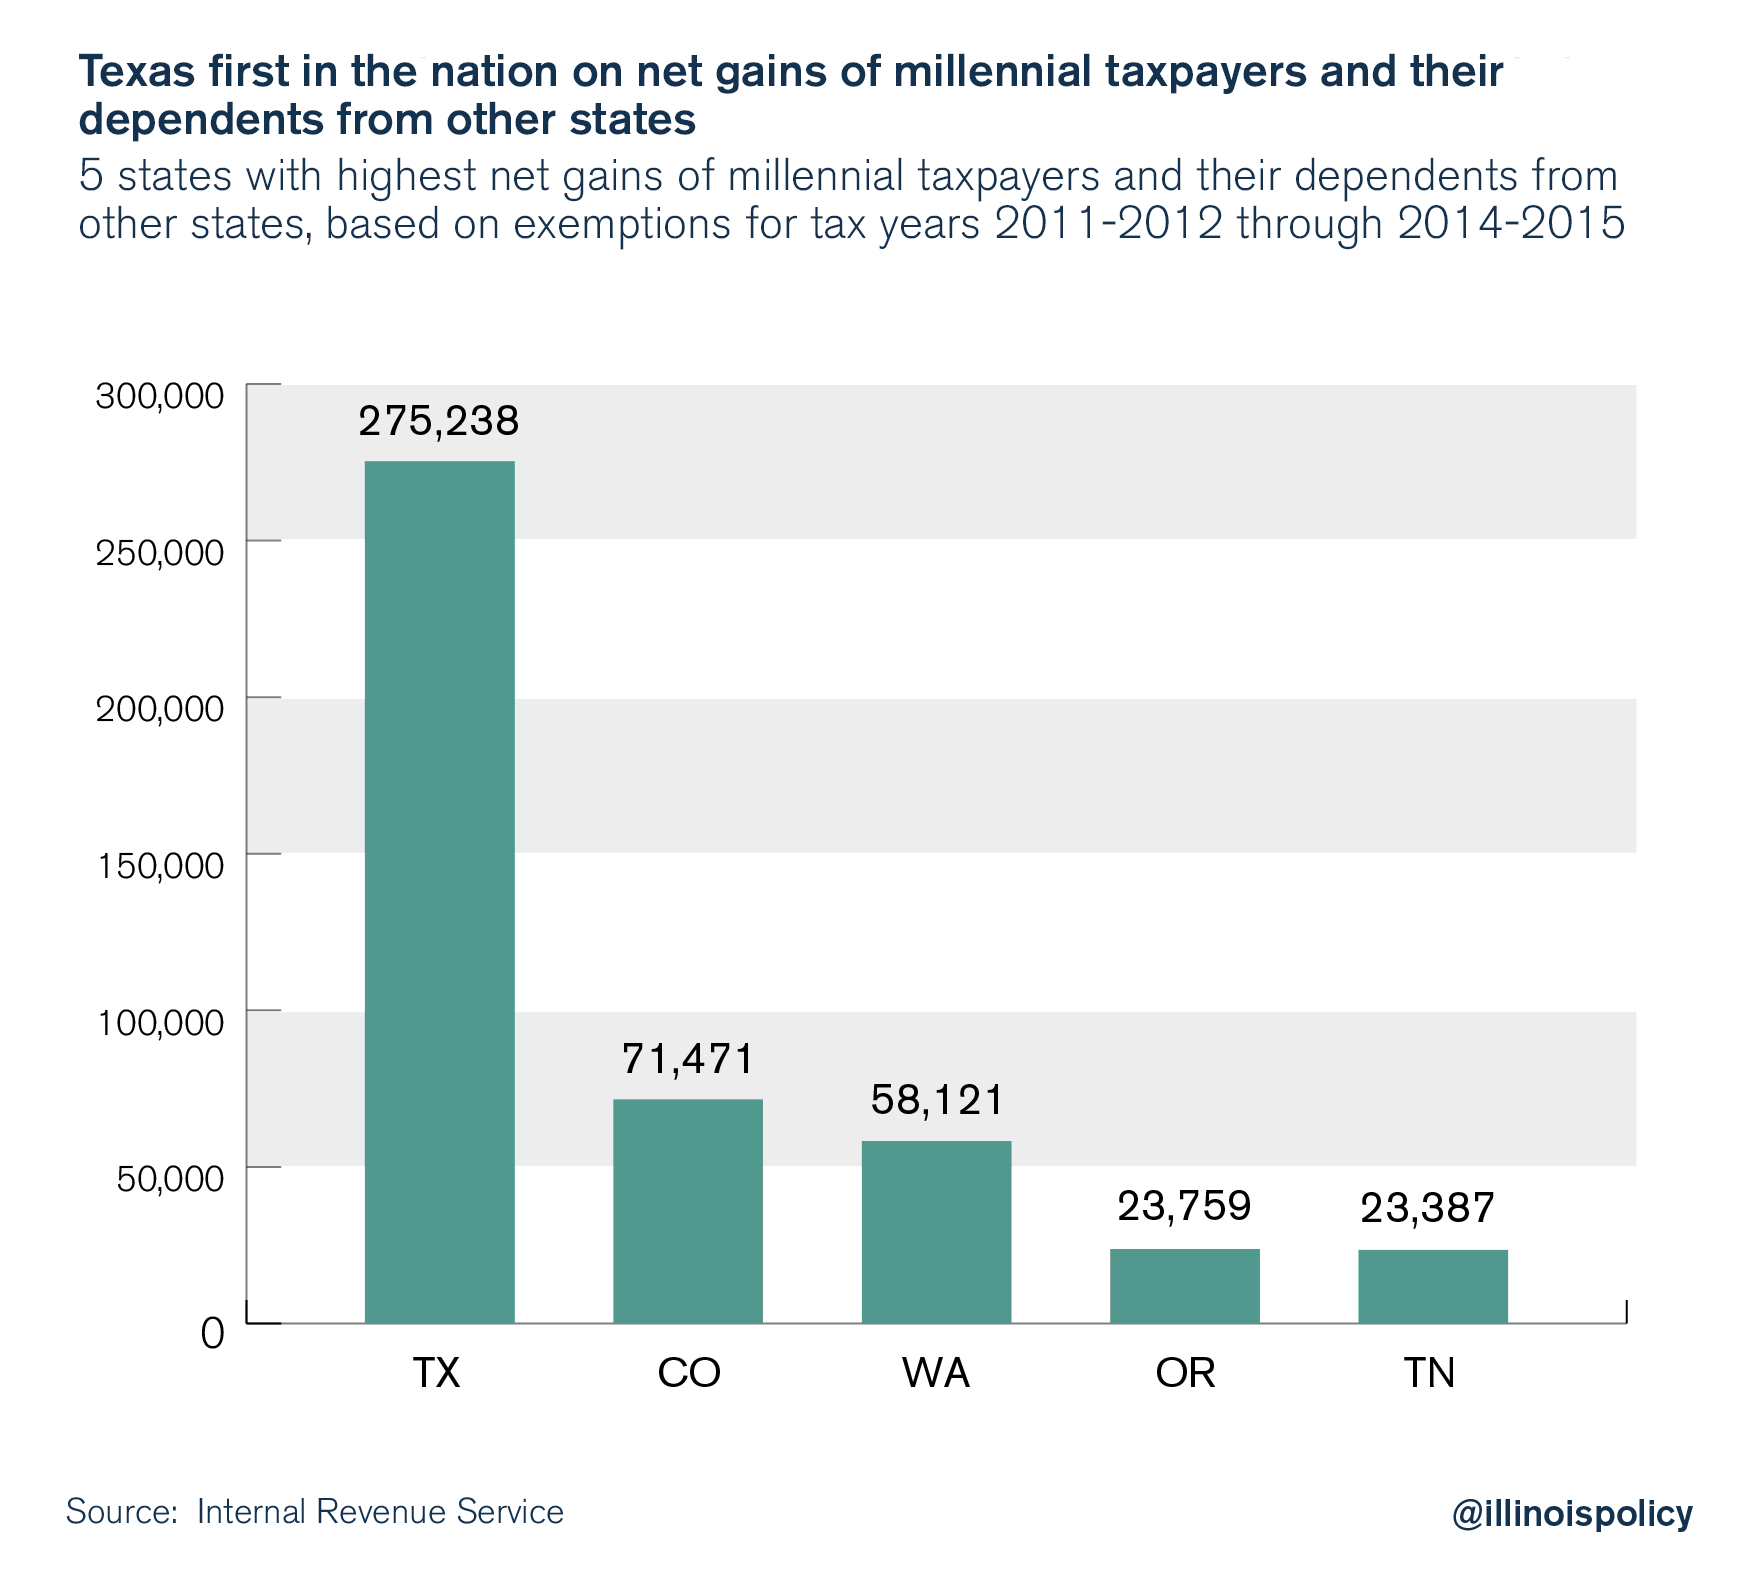
There are clear winners and losers in the border wars for millennials, considering that IRS data show Texas having gained 275,000 millennial taxpayers and their dependents, on net, while New York lost 137,000, on net, over the same period. Closer analysis of these emerging state-to-state migration patterns may shed some light on the factors driving millennials’ state-of-residence preferences.
Context clues also provide some insight. A defining characteristic of the millennial generation is that its members largely entered the workforce in the midst of or shortly after the Great Recession, when jobs growth was scarce and career opportunities were hard to find. Indeed, many states, such as Illinois, are still recovering.35 For this reason, millennials may reasonably be more inclined to follow job opportunities, or congregate in states with stronger jobs growth. Millennials are also earning less than their parents,36 which has likely influenced where they choose and can afford to live. Incidentally, some data suggest young adults may be increasingly drawn to midsize cities that offer the perks of city life with a more affordable cost of living (e.g., Austin, Texas and Raleigh, N.C.), as opposed to traditional metropolitan hubs such as New York, Chicago and San Francisco.37, 38
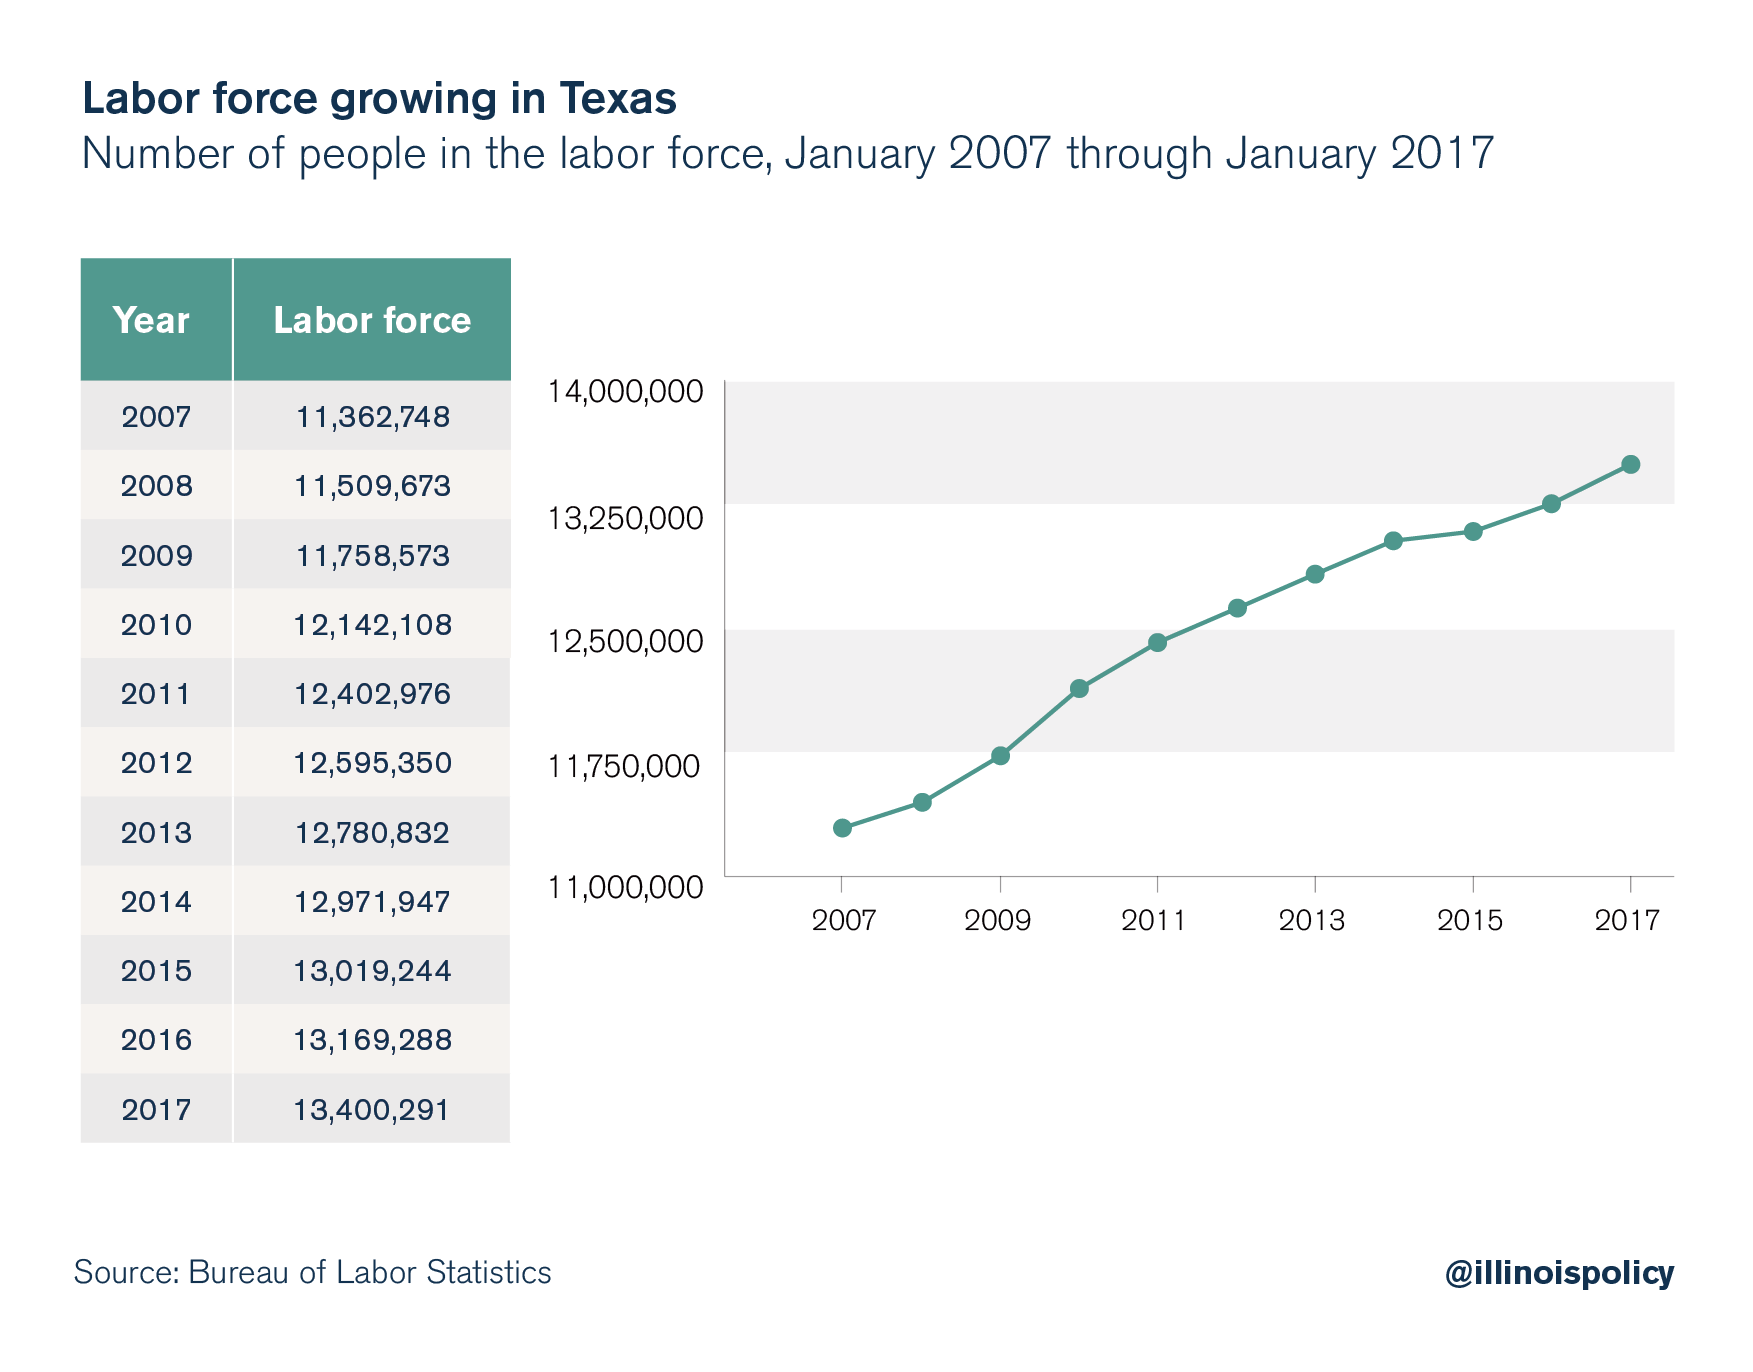
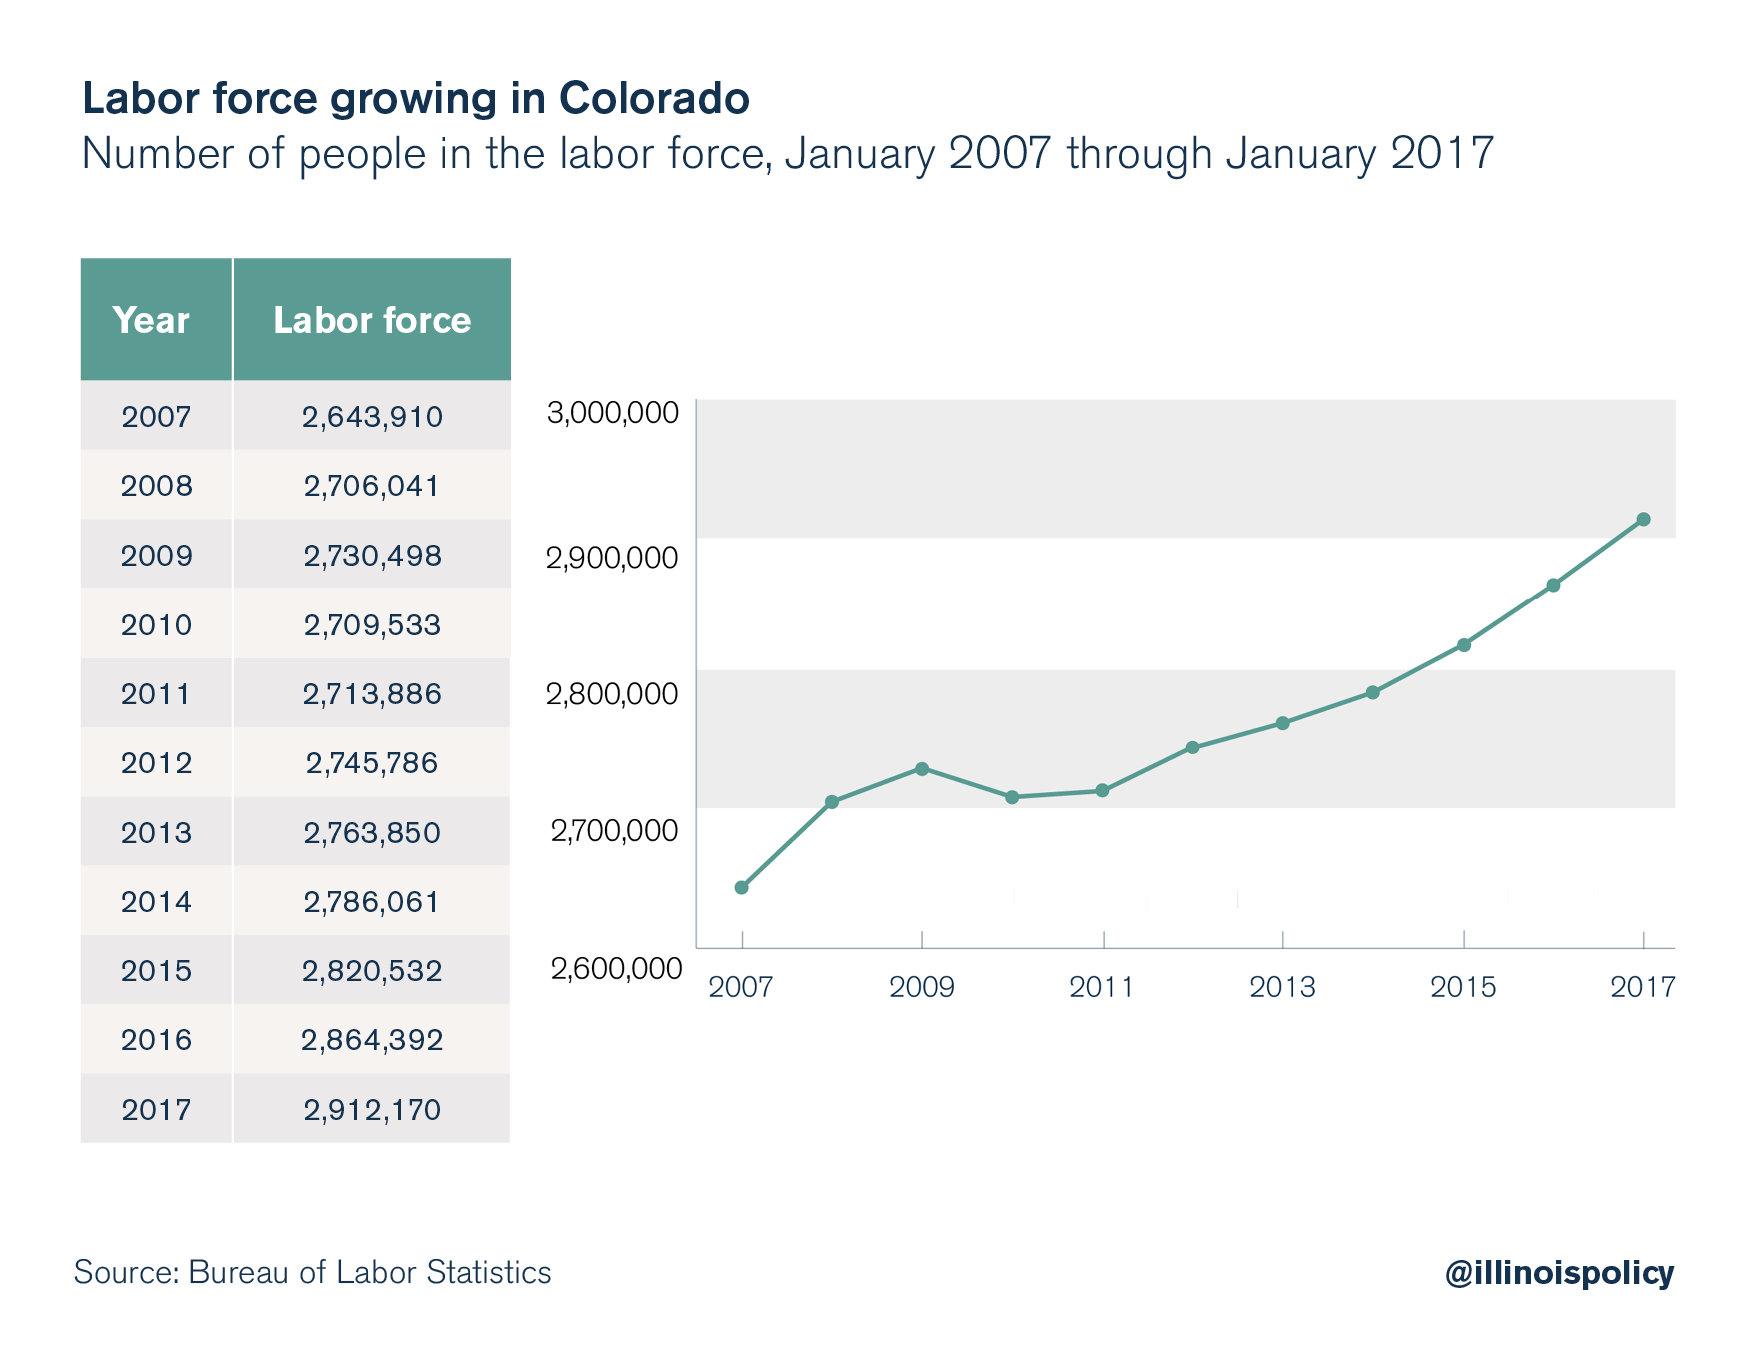
Based on the states winning and losing millennials, the above variables appear to at least play a role in where millennials are moving. Texas39 and Colorado,40 for instance, gained the most millennials, on net, over the four tax years from 2011-2012 through 2014-2015, and these states have both experienced some of the fastest, steadiest employment growth, as measured by the number of people employed. Similarly, the Texas and Colorado labor forces have also seen robust growth since the lowest point of the Great Recession.41 Texas is also home to Austin and other midsize cities that likely appeal to this young demographic. Denver, Colo.; Seattle, Wash.; Portland, Ore. and Nashville, Tenn., are all located within the top five net-gaining states and have that same midsize city appeal.
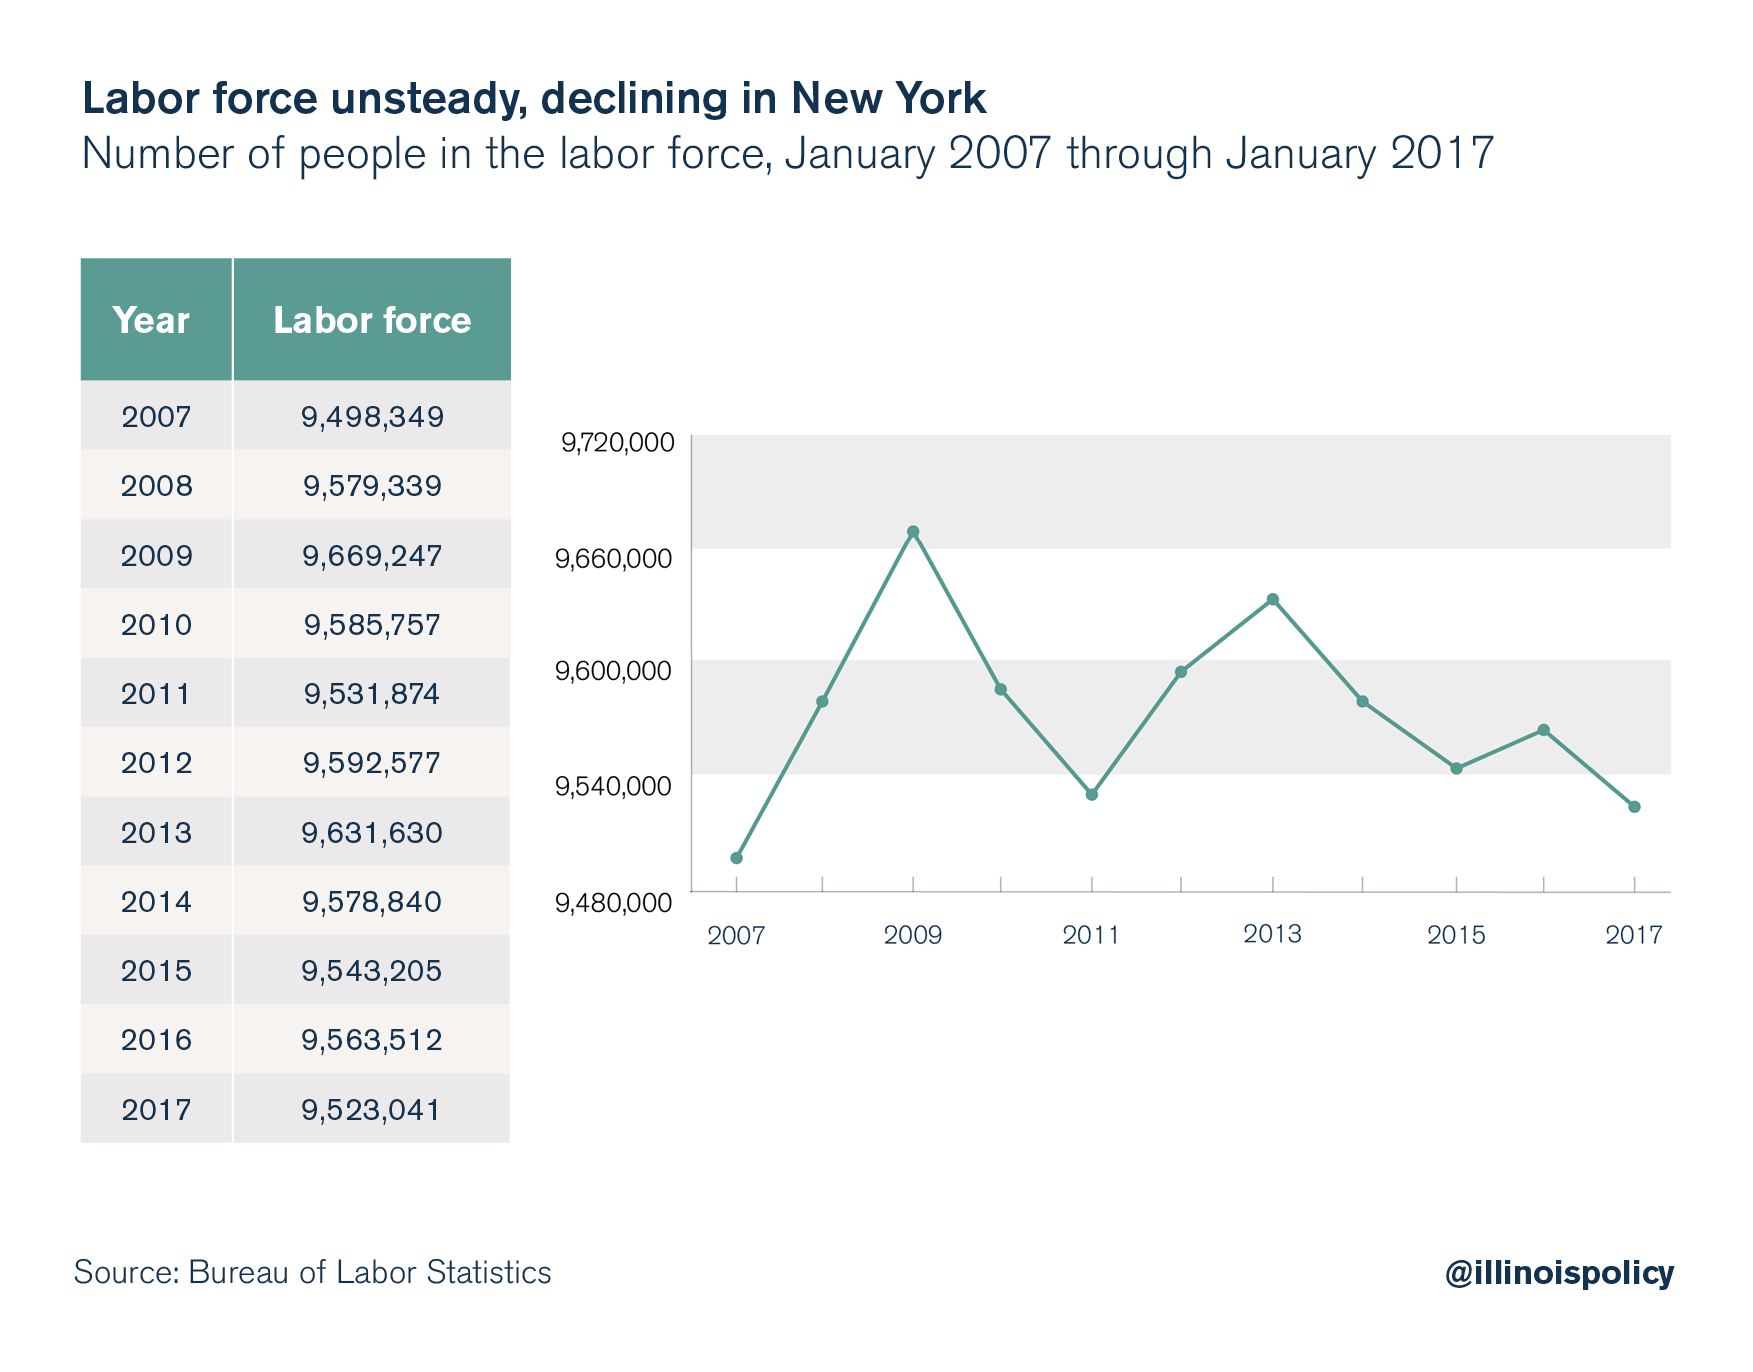
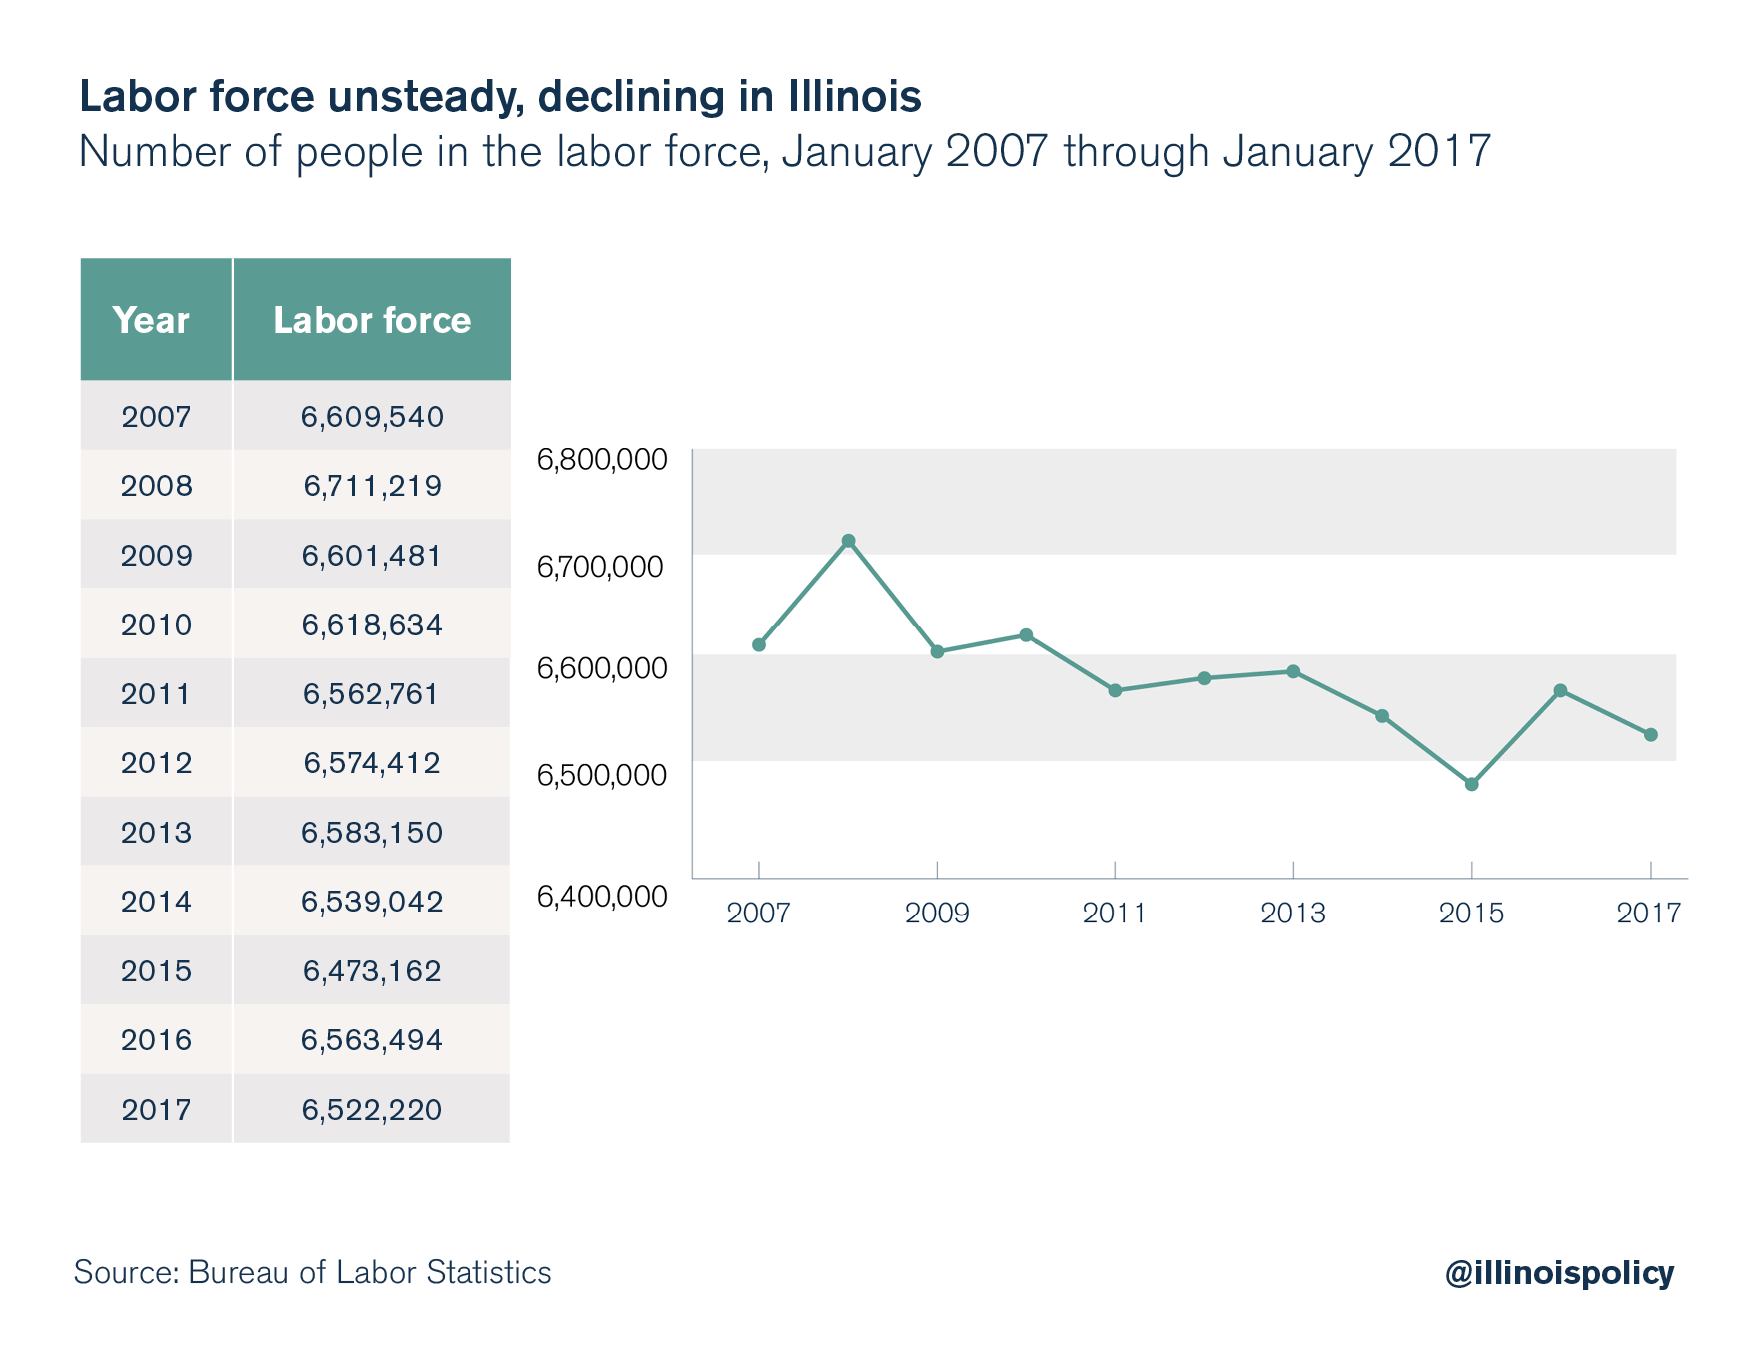
By contrast, New York and Illinois, the two biggest net losers of millennials to other states, are home to traditional metropolitan hubs – New York City and Chicago – being edged out by more affordable, up-and-coming metropolitan areas. New York and Illinois have also seen ebbs and flows in their generally declining labor forces and have not yet put people back to work at the same rate as during pre-recessionary highs. (New York, though, is getting close.)42,43 Further study would be necessary to confirm whether these factors are indeed steering millennial interstate migration.
Millennial students
Given that NCES student migration data only account for even-numbered years, the following comparisons are based on each state’s performance in the eight even-numbered years from 2000 through 2014. The actual net gains or net losses of millennial college students over the 15-year period are likely nearly double those reflected in the even-numbered years for each state.
Illinois suffered the second-worst millennial college student net loss to out-migration nationally, behind New Jersey. When comparing average yearly net gains or net losses to average yearly total first-time student enrollment in the state, Illinois fared only marginally better, ranking sixth worst nationally.
While 16 states lost millennial college students to out-migration, on net, 34 states and the District of Columbia experienced net gains.
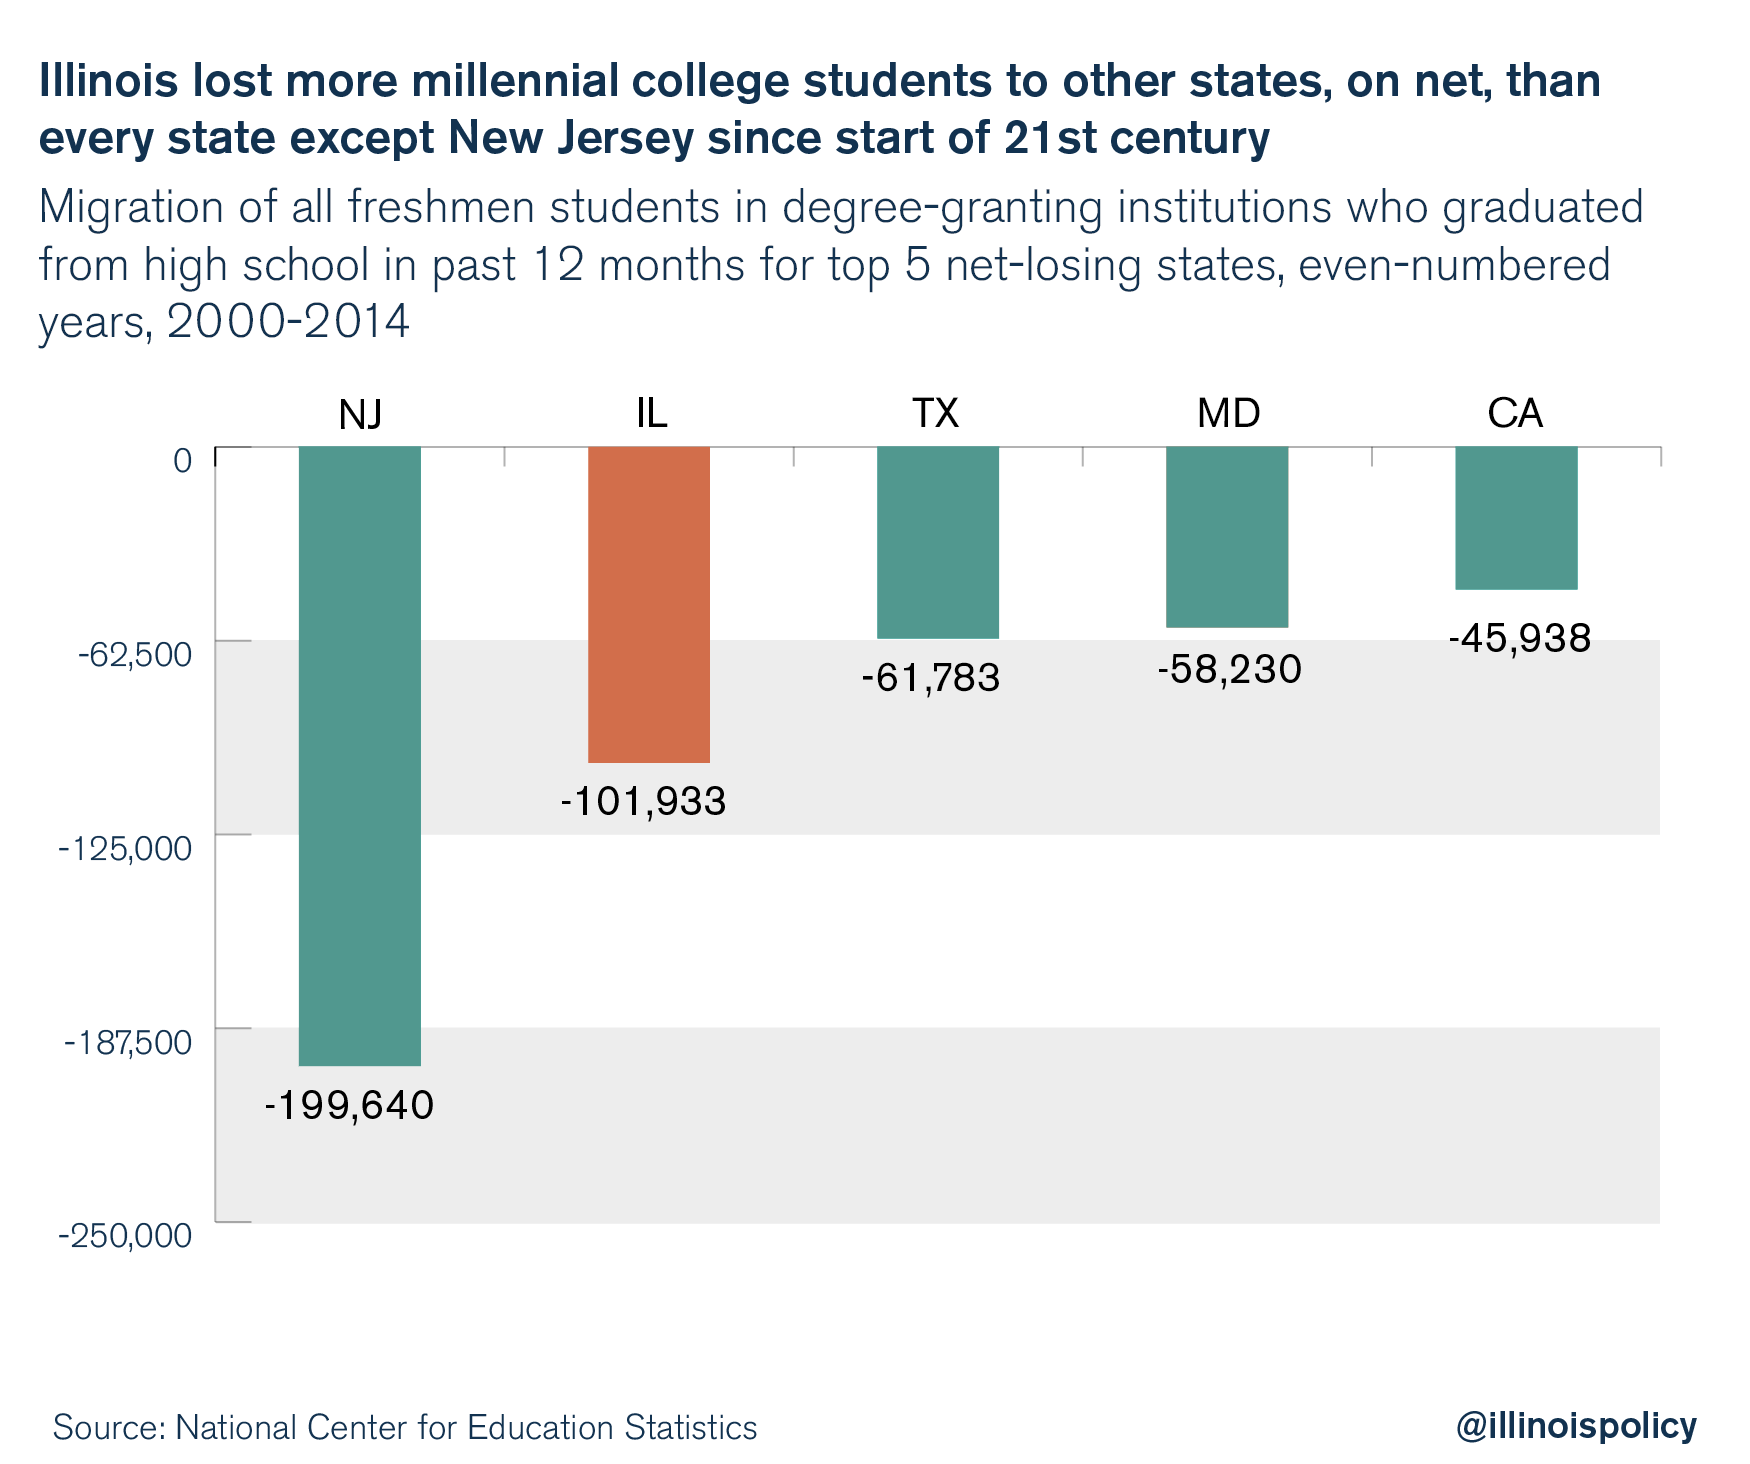
The five states that lost the most higher education millennial students, on net, to other states over the course of the eight even-numbered years between 2000 and 2014 were New Jersey at -200,000, Illinois at -102,000, Texas at -62,000, Maryland at -58,000 and California at -46,000.
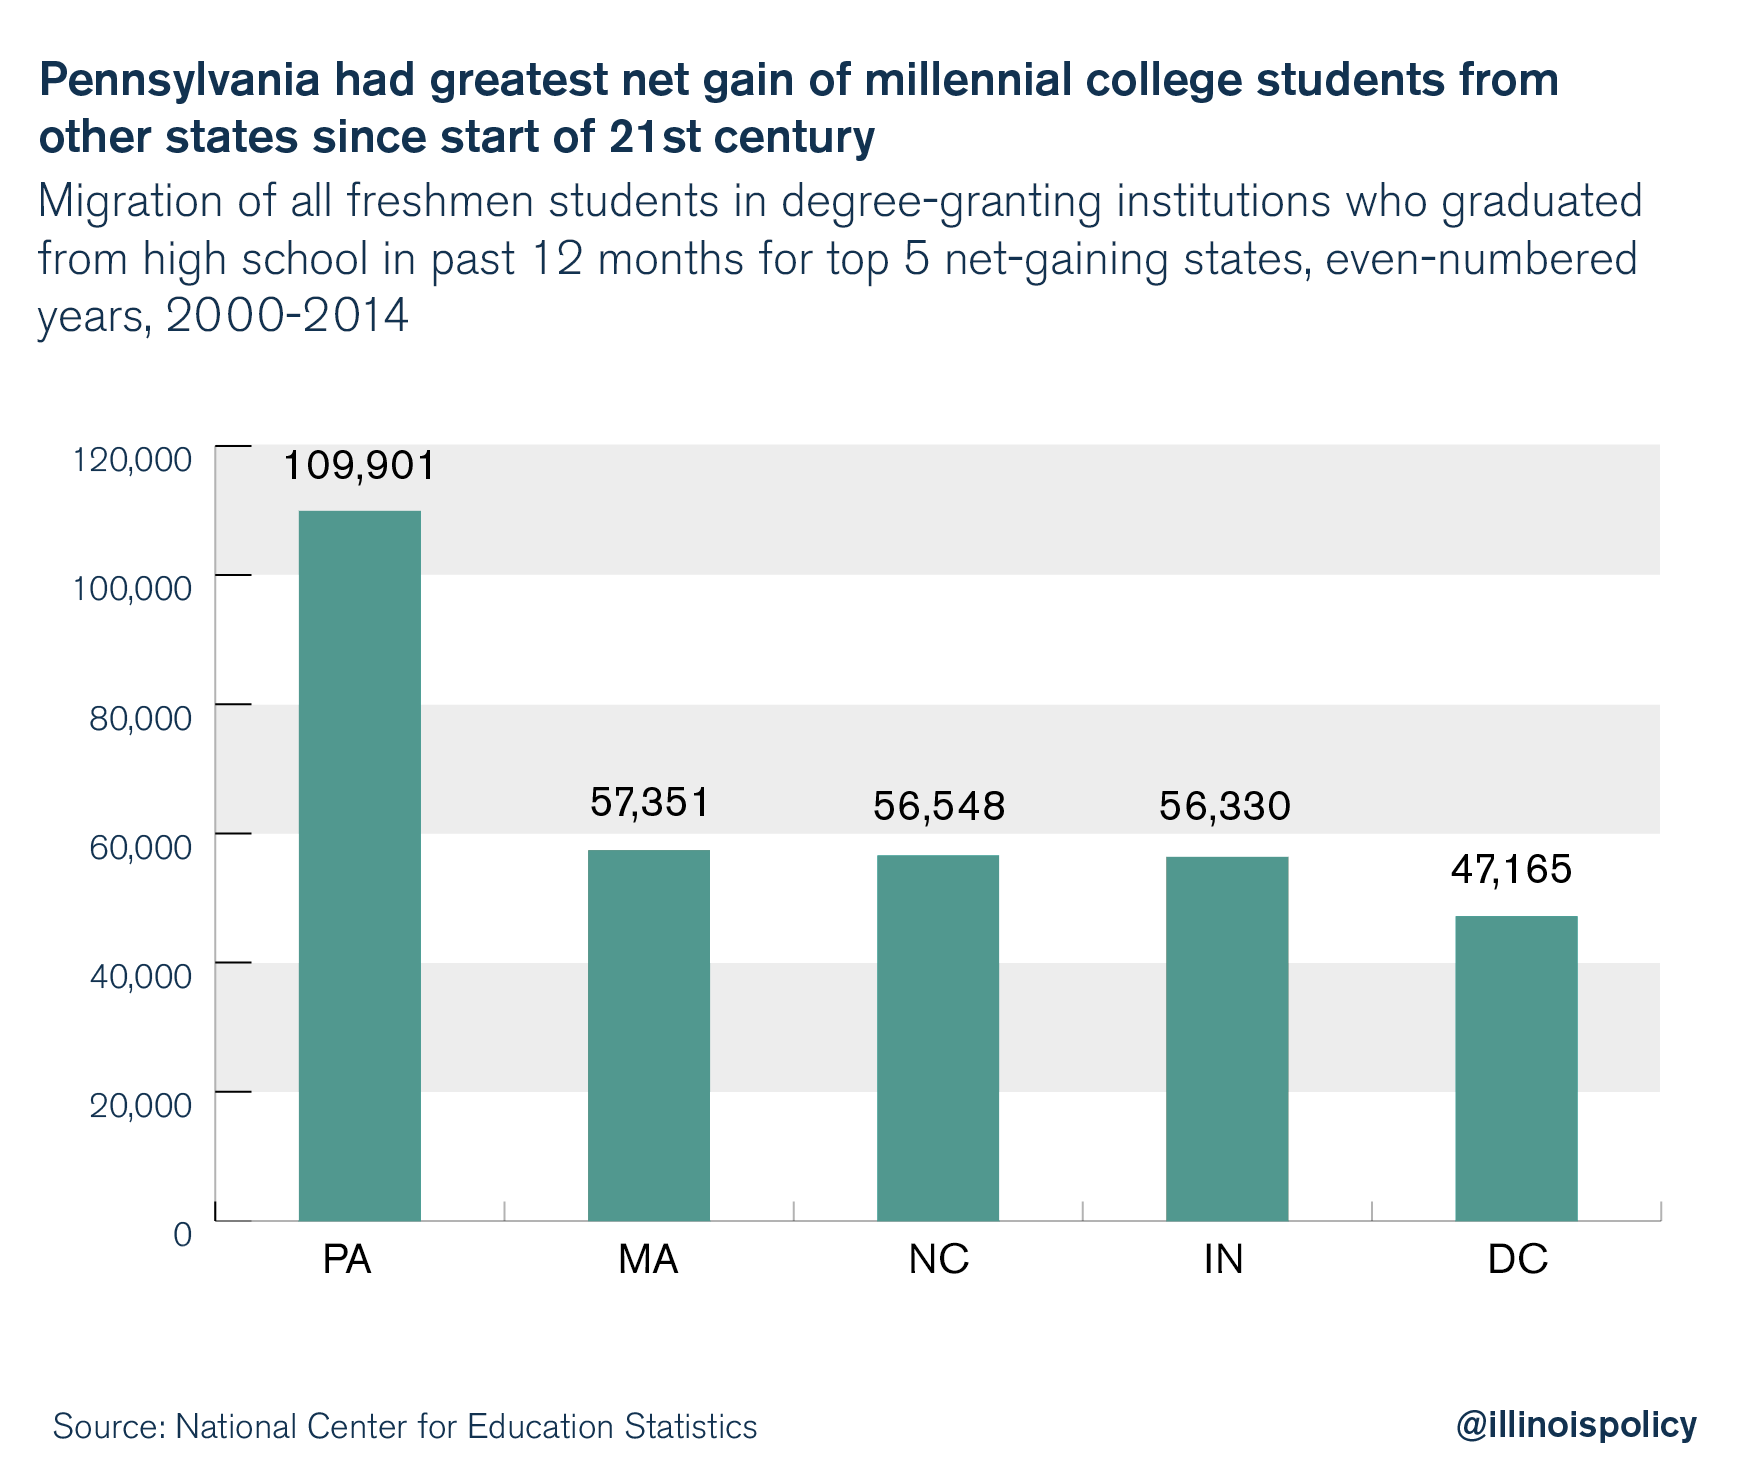
The five states that gained the most higher education millennial students, on net, from other states were Pennsylvania at 110,000, Massachusetts at 57,000, North Carolina at 57,000, Indiana at 56,000 and the District of Columbia at 47,000.
As mentioned above, a number of factors figure in the university-selection process; and each state likely has its own reasons for being more or less competitive for the millennial college student population. Texas and Pennsylvania represent how a state’s appeal to the general millennial population does not necessarily positively correlate with its standing with millennial college students. While Texas is among the top five states gaining the most millennial taxpayers and their dependents, on net, according to the IRS data, it is among the five worst states when it comes to millennial college student net losses, according to the NCES data. The reverse is true for Pennsylvania. Although other factors may be at play, a major cause of Texas’ dismal millennial higher education student net losses is the incapacity of the state’s public universities to accommodate all Texas students, even if they wanted to stay.44 Meanwhile, Pennsylvania gains millennial college students, on net, due to a broad selection of colleges and universities with a strong educational legacy. However, Pennsylvania can scarcely hang on to those students after graduation.45
There are likely some underlying deficiencies making certain states weak on millennial higher education student migration. The severity of the situation, even for net-losing states, however, will vary by state. For instance, a state such as Texas may be willing to lose students if it is confident it will gain them back after they graduate. Student net losses are much more pressing for a state such as Illinois, which loses big on both millennial college students, and young working-age adults and their dependents. Benefits of having a thriving college student population include: booming college towns ripe for entrepreneurial investment, the potential to retain students from other states as taxpayers after college and the ability to grow the state population and economy over time.46
Conclusion
Illinois’ shrinking population proves that mass out-migration is increasingly draining the state, and the data show that youth are leaving the fastest. Illinois lost as many as 37,000 millennials, on net, yearly from 2011 through 2014, amounting to a total net loss of as many as 148,000 millennials over that four- year period alone. Illinois’ net loss of millennial taxpayers and dependents and its net loss of millennial college students are each second-worst in the nation, showing that Illinois’ youth problem is far worse than average. Millennials do not see a future in Illinois worth moving in for – and the erosion of the state’s future population is sure to cause further economic disarray in Illinois.
Whatever their reasons for leaving, millennials are justified in getting out while they can. Illinois’ taxes and debt amount to severe generational inequity: The baby boom generation promised its public employees extensive pension benefits, which millennial taxpayers will have to finance. Illinois’ decades of government overpromising, frivolous spending and poor pension funding have created an unfair system of generational legacy debt.
Illinois’ unfunded government worker retirement debt, which now totals $267 billion,47 will be borne by young taxpayers throughout their lifetimes – despite the fact that they played no role in creating the debt and the ensuing economic crisis. Lawmakers are counting on young people entering their prime earning years in Illinois and paying into government coffers. The problem is, these young people are already leaving. Millennials may not directly understand that Illinois’ system has created generational inequity, but they are jumping ship regardless. As it stands, millennials who stay in Illinois can expect to fund the generational inequity that has resulted from the state’s debts and unsustainable pension system. Lawmakers have a moral obligation and vested interest in getting this massive cost driver under control, instead of continuing to kick the can down the road for future taxpayers.
Illinois needs to be smarter about retaining its millennial population. The Land of Lincoln will never boast ocean views or year-round warm weather, so it needs to compensate through the areas it can control, such as jobs growth and taxes. By fixing cost drivers, decreasing the cost of doing business in Illinois, and easing the tax burden, Illinois can encourage jobs growth and stand a better chance at attracting and retaining younger people. Similarly, passing a balanced budget and addressing rising pension and administrative costs would alleviate funding and tuition uncertainty to make the state more competitive for students and future taxpayers. Illinois’ youth population is already contracting, and now is the time for lawmakers to make Illinois fairer and more competitive for millennials and future generations.
Endnotes
- Susan Adams, “The States People Are Fleeing,” Forbes, January 13, 2015.
- Marwa Eltagouri, “Illinois Loses More Residents in 2016 Than Any Other State,” Chicago Tribune, December 21, 2016.
- Michael Lucci, “Here’s Why Moody’s Is Warning of an Illinois Death Spiral,” Illinois Policy Institute, January 17, 2017.
- Michael Lucci, “Illinois’ 2015-2016 Out-Migration Problem Is Much More Dire than in Other Midwestern States,” Illinois Policy Institute, January 11, 2017.
- Madelyn Harwood, “Fact-Checking Rahm: Students Have Been Leaving Illinois for at Least 15 Years,” Illinois Policy Institute, March 13, 2017.
- U.S. Census Bureau, “Glossary.
- Richard Fry, “Millennials Surpass Gen Xers as the Largest Generation in U.S. Labor Force,” Pew Research Center, May 11, 2015.
- Ibid.
- Fred Dews, “Brookings Data Now: 75 Percent of 2025 Workforce Will Be Millennials,” The Brookings Institution, July 17, 2014.
- The millennial age brackets within the IRS data are limited to either (1) millennial migrants who led their own tax returns, or (2) dependents who were claimed as such on a millennial parent’s tax returns. Thus, the millennial age brackets within the IRS data likely do not cover many college-bound millennial students, who may be reflected as exemptions on their parents’ tax returns in older age brackets. In addition, a millennial college student who is claimed as a dependent on her parents’ tax returns, assuming her parents stayed in Illinois, would not show up in the IRS data as having moved.
- Crude birth rate minus crude death rate.
- Michael Lucci, “Illinois Losing 1 Resident Every 5 Minutes to Out-Migration,” Illinois Policy Institute, December 23, 2015.
- Michael Lucci, “Illinois Losing 1 Resident Every 4.6 Minutes, Could Fall Behind Pennsylvania in Population,” Illinois Policy Institute, December 20, 2016.
- “Utah is Nation’s Fastest-Growing State, Census Bureau Reports,” U.S. Census Bureau, December 20, 2016.
- Michael Lucci, “Illinois Losing 1 Resident Every 4.6 Minutes, Could Fall Behind Pennsylvania in Population.”
- Michael Lucci, “Illinois Losing 1 Resident Every 5 Minutes to Out-Migration.”
- As noted above, some students may be counted twice if they claimed themselves as exemptions on individually led taxes.
- “Illinois Voters Ask: Should I Stay or Should I Go?,” Southern Illinois University Carbondale Paul Simon Public Policy Institute, October 10, 2016.
- Internal Revenue Service, “U.S. Population Migration Data,” October 13, 2016.
- National Center for Education Statistics, “List of Current Digest Tables”.
- Implied losses are the average of losses for the years immediately preceding and following 2011 and 2013.
- Fran Spielman, “Emanuel Labels Rauner ‘the Emperor Who Wears No Clothes,’” Chicago Sun-Times, March 7, 2017.
- Ted Dabrowski and John Klingner, “Pensions vs. Higher Education,” Illinois Policy Institute.
- Ibid.
- “College Profile: University of Illinois at Urbana-Champaign,” Collegedata.
- “College Profile: University of Wisconsin – Madison,” College data.
- “College Profile: University of Michigan,” Collegedata.
- “College Profile: Indiana University Bloomington,” Collegedata.
- “College Profile: University of Kentucky,” Collegedata.
- “College Profile: University of Iowa,” Collegedata.
- “College Profile: University of Missouri – Columbia,” Collegedata.
- Midwest Student Exchange Program, “How MSEP Works,” 2017.
- Ted Dabrowski, Craig Lesner and John Klingner, “Budget Solutions 2018 Saving Illinois: Balancing the Budget without Tax hikes,” Illinois Policy Institute.
- Madelyn Harwood, “Fact-Checking Rahm: Students Have Been Leaving Illinois for at Least 15 Years.”
- Michael Lucci, “Illinois One of Few States Still Recovering from the Great Recession,” Illinois Policy Institute, July 5, 2016.
- Associated Press, “Millennials Earn 20% Less Than Boomers Did at Same Stage in Life,” USA Today, January 13, 2017.
- Mark Uh, “Can’t Afford Housing in Your Expensive City? The Solution for Many Is to Move Out,” Trulia, April 28, 2016.
- Kia Kokalitcheva, “Millennials Are Increasingly Looking for Jobs in These Mid-Size Cities,” September 20, 2016.
- Bureau of Labor Statistics, “Local Area Unemployment Statistics,” data extracted March 26, 2017.
- Bureau of Labor Statistics, “Local Area Unemployment Statistics,” data extracted March 26, 2017.
- Jake Grovum, “Which States Have the Most Jobs Growth Since the Great Recession,” The Pew Charitable Trusts, May 13, 2015.
- Bureau of Labor Statistics, “Local Area Unemployment Statistics,” data extracted March 26, 2017.
- Bureau of Labor Statistics, “Local Area Unemployment Statistics,” data extracted March 26, 2017.
- Jeff Guo, “These States Are Terrible at Hanging on to Their College-Bound Students,” Washington Post, April 8, 2015.
- Eleanor Klibanoff, “Pa. Attracts College Students, But Getting Them to Stay After Graduation Is a Challenge,” Keystone Crossroads, August 4, 2015.
- Bob Davis, “There’s an Antidote to America’s Long Economic Malaise: College Towns,” Wall Street Journal, December 12, 2016.
- Ted Dabrowski and John Klingner, “Each Illinois Household on the Hook for $56K in Government-Worker Retirement Debt,” Illinois Policy Institute, March 23, 2017.