Illinois educators pay hundreds of dollars every year in dues to their unions.
Many members expect that money to pay for services they value, such as collective bargaining, local events and scholarships.
But a significant portion of members’ money flows to state and national affiliates, most of which admit spending far more money on things such as high administrative salaries, politics and their own benefits than on teacher representation and local issues.
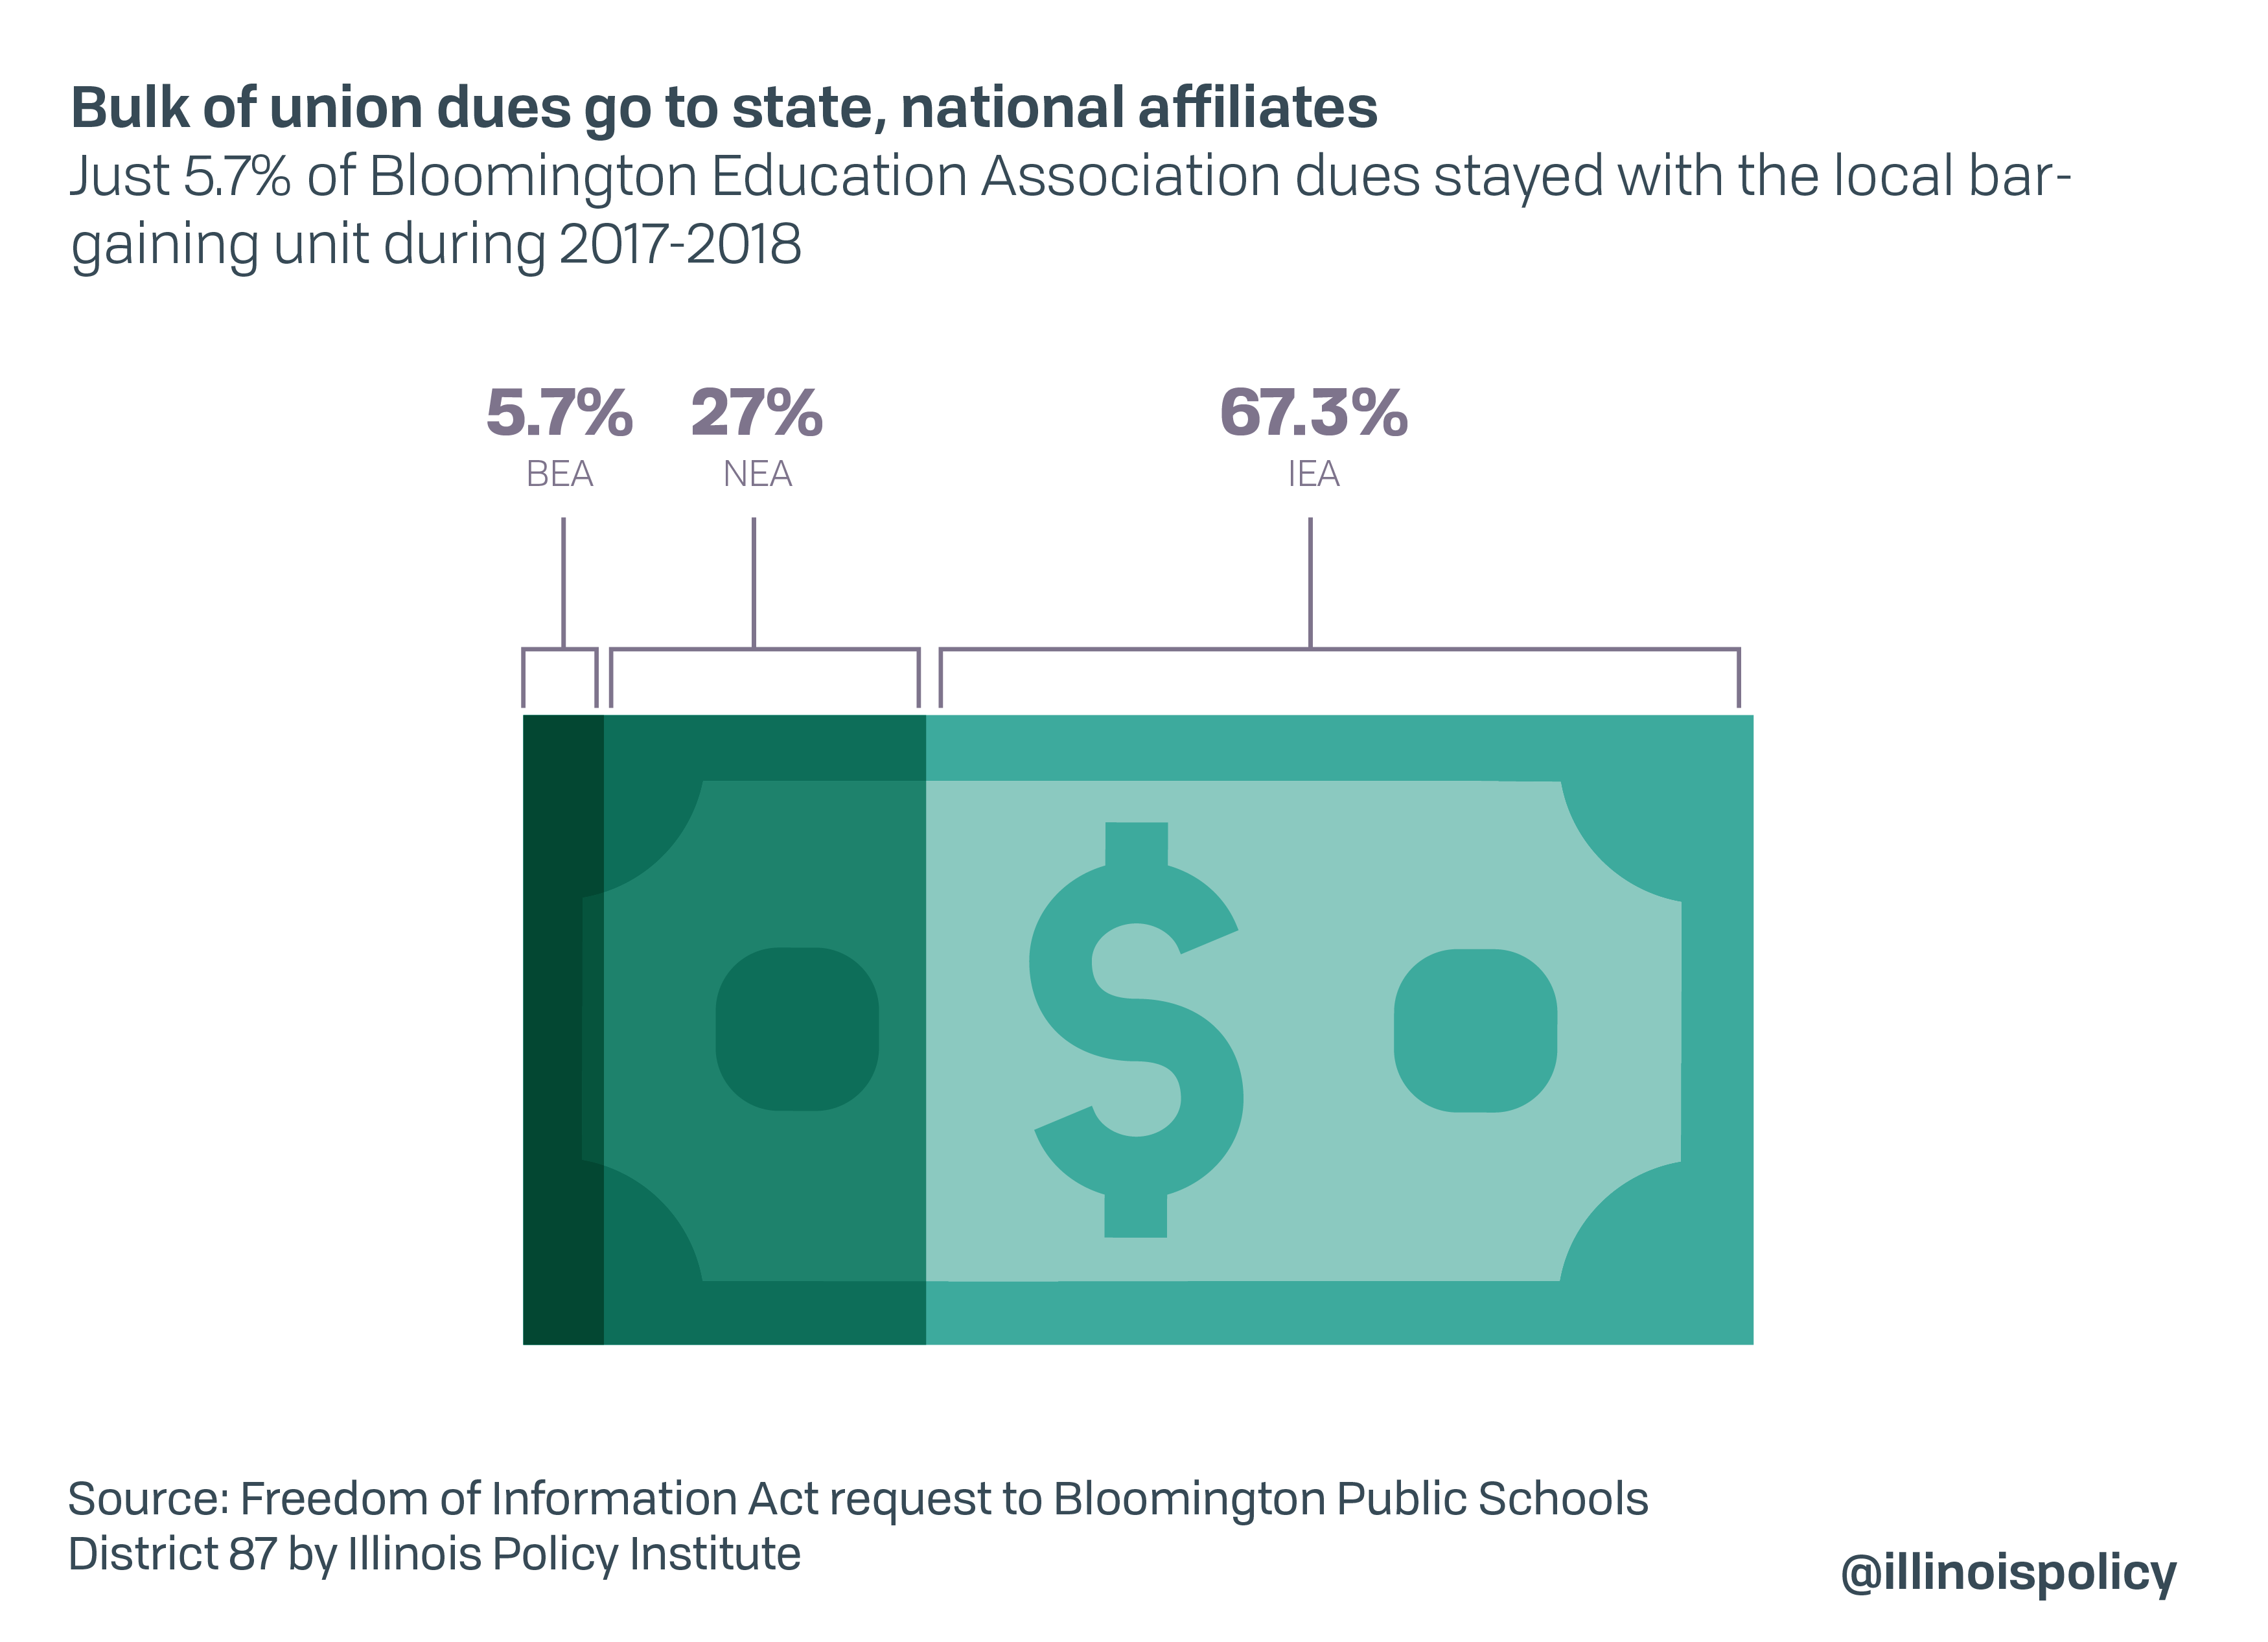
For example, a full-time teacher in Bloomington Public Schools District 87 who was a member of the Bloomington Education Association paid $701 in dues for the 2017-2018 school year. Here is how those union dues were spent:
- $472 went to the Illinois Education Association, the state affiliate
- $189 went to the National Education Association, the national affiliate
- Only $40, or 5.7%, stayed with the local bargaining unit1
With the majority of dues flowing to state and national affiliates, teachers have a right to know how those affiliates are spending money.
The best source for examining union spending is LM-2s, which are federal reports unions file annually with the U.S. Department of Labor.2 These official filings provide insight into union spending patterns in the unions’ own words.3 Unfortunately, they are often confusing, hundreds of pages long and difficult to access.
To assist teachers in evaluating union spending, this report includes spending data on the following five areas:
- Representational spending
- Spending on leadership
- Spending on local affiliates
- Political spending
- Questionable, non-itemized spending.
This information is provided for the National Education Association (NEA) and its state affiliate, the Illinois Education Association (IEA), as well as for the American Federation of Teachers (AFT) and its state affiliate, the Illinois Federation of Teachers (IFT).
National Education Association (NEA)
Between 2013 and 2018, the National Education Association spent $2.2 billion, or an average of more than $365 million a year.4
With the NEA spending more than $1 million a day, its members have a right to know how the union prioritized that spending during that period.
Representation: Only 12% of NEA spending was for representational activities
NEA reported it spent just $45 million a year on average for representational activities5 – those activities related to negotiating collective bargaining agreements and the administration and enforcement of agreements.6
That means just 12% – or 12 cents of every $1 – of NEA’s total spending each year went toward representing its members.
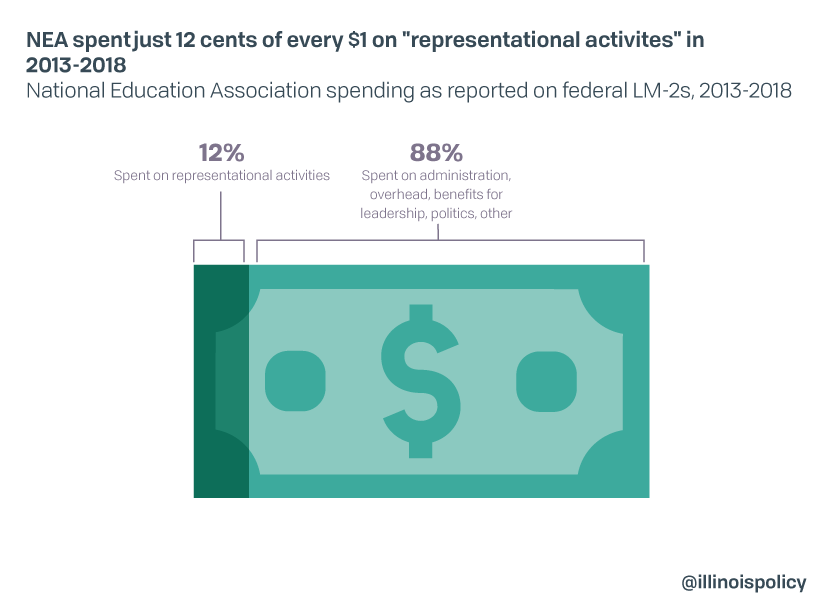
NEA spent the rest on things such as administration, overhead, benefits for the union’s own officers and employees – and politics.
To place this in perspective, the Wise Giving Alliance, a project of the Better Business Bureau, maintains a nonprofit should spend at least 65% of its total expenses on program activities.7
While the Wise Giving Alliance tracks spending by charities, it stands to reason that NEA’s spending of just 12% on representation – the purpose of a union – should be a cause for concern among members.
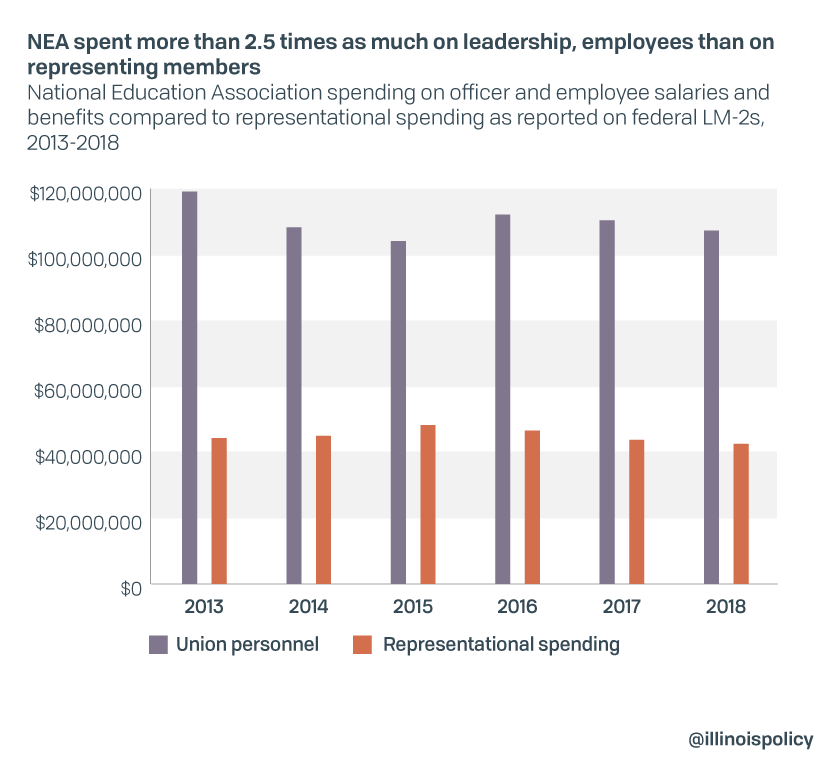
Leadership: NEA spent more than 2.5 times more on its own salaries and benefits than it did on representing teachers
NEA reported it spent $58.8 million a year on average for officer and employee salaries for tasks unrelated to representational activities in 2013-2018.8
It spent an additional $60.9 million a year on benefits for its own officers and employees.9
Combined, NEA spent nearly $120 million on its own leadership and employees – which is over 2.5 times more than it spent on representing its members.
And while Illinois public school educators make less than $66,000 a year on average,10 the top 10 earners at NEA in 2018 made over $250,000 in 2018 – with NEA President Lilia Eskelsen Garcia topping $414,000 a year.

Affiliate support: Just 4% of funds NEA directed to affiliates went to affiliates in Illinois
Between 2013 and 2018, NEA disbursed $681 million to its state and local affiliates.11
Yet less than $29 million – just 4% – went to affiliates in Illinois.12
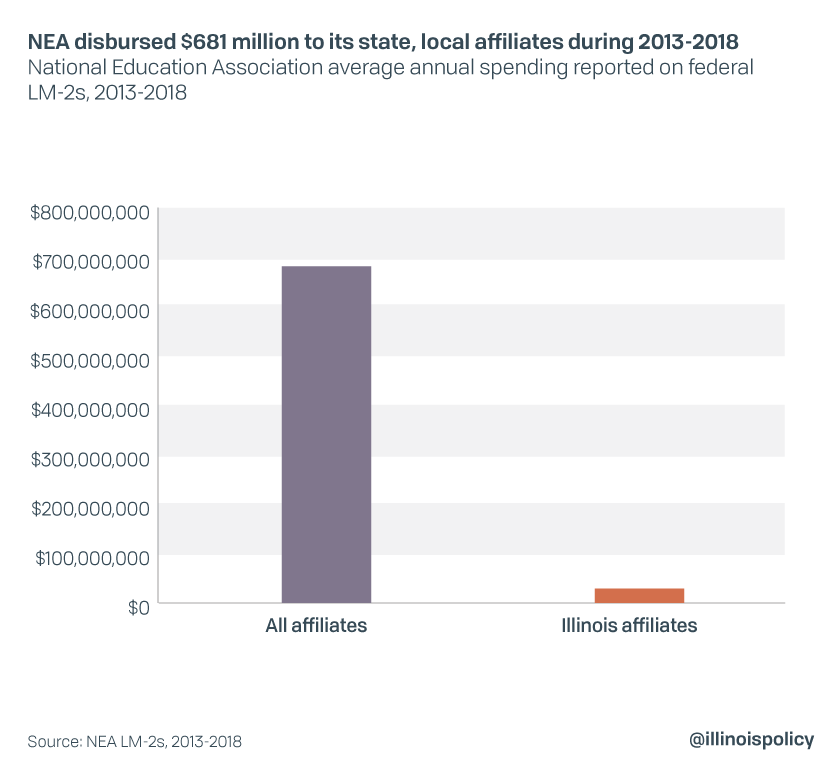
While Illinois teachers sent thousands of dollars up the chain to NEA, they saw very little come back to their own state.
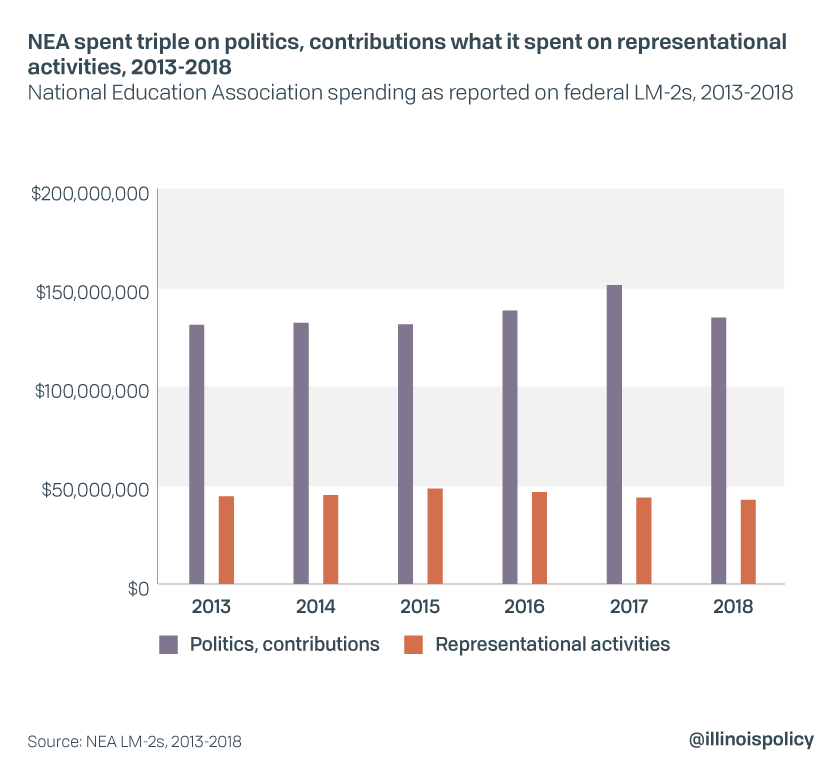
Political spending: NEA spent more on politics and contributions than it did on representation
In each of the past six years, NEA spent more on politics and other contributions – which often are politically or ideologically based – than it did on representational activities.
NEA reported it spent more than $136.4 million a year on average13 for “political activities and lobbying”14 and “contributions, gifts, and grants.”15
That means it spent more on politics and contributions – 37% of its total spending – than it did on representing workers.
Examples of NEA’s political spending and contributions in 2013-2018 include the following:
- Over $46.2 million to its own super PAC, the NEA Advocacy Fund, which can then be spent in any way it wants
- At least $5.3 million to For our Future/For our Future Action Fund, which is “committed to serving progressive values”
- Over $2 million to America Votes/America Votes Action Fund, which calls itself the “coordination hub of the progressive community”
- Over $262,000 for the Presidential Inauguration in 2013.16
NEA members might not have supported the causes or organizations NEA funded with their dues. At a minimum this shows NEA prioritized politics and contributions over representing workers or other member-targeted projects.
Questionable spending: NEA spent millions on airlines, hotels and other luxuries for unspecified purposes
While some disbursements in an LM-2 are attributed to things such as membership meetings, member education, conventions or other purposes, many are not. That’s because unions do not have to itemize disbursements that fall below $5,000.17 A recipient is listed, but the exact reason for the disbursement is not.
Between 2013 and 2018, NEA spent the following for unspecified purposes:
- $22.9 million to airlines
- $16.9 million to hotels
- More than $2.2 million for catering
- More than $1.7 million for a travel agency
- More than $324,000 for car rentals
- More than $170,500 for Amtrak
- More than $58,000 for a concierge
- Almost $32,000 to Barnes & Noble
- More than $13,000 for other transportation (not airline, train, or car)
- More than $8,500 for “entertainment”
- $6,000 to a cruise line18
Because these disbursements were non-itemized, there is no way for members to evaluate whether the spending was appropriate. Members cannot hold union leadership accountable.
Illinois Education Association (IEA)
The Illinois Education Association represented over 137,000 members in Illinois in 2018.19 Between 2013 and 2018, IEA spent nearly $454 million, or an average of $75.7 million a year.20
Its members have a right to know how the union prioritized that spending from 2013-2018.
Representational spending: Less than 13% of IEA spending was for representational activities
IEA reported it spent just $9.7 million a year on average for representational activities21 – those activities related to negotiating collective bargaining agreements and the administration and enforcement of agreements.22
That means less than 13% – or just 13 cents of every $1 – of IEA’s total spending each year was directed toward representing its members.
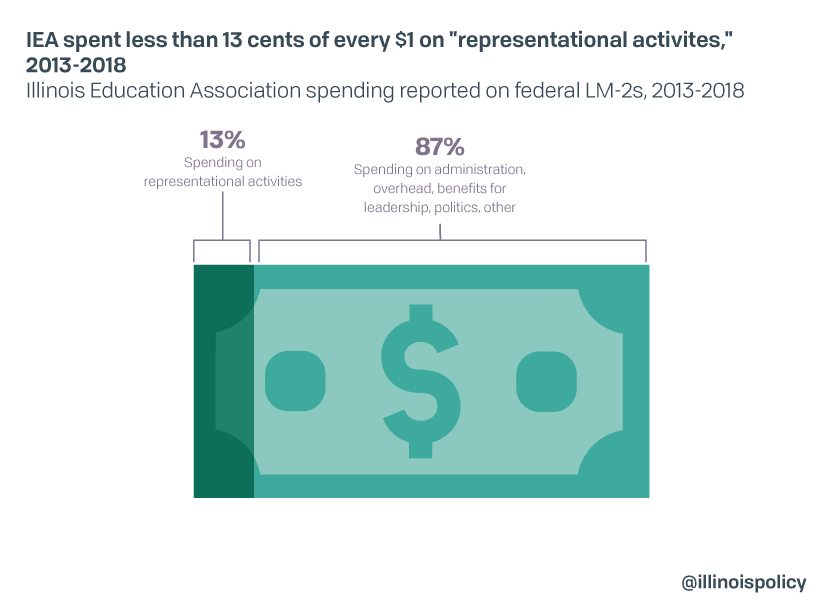
IEA spent the rest on things such as administration, overhead, benefits for the union’s own officers and employees, and politics.
To place this in perspective, the Wise Giving Alliance, a project of the Better Business Bureau, maintains a nonprofit should spend at least 65% of its total expenses on program activities.23
While the Wise Giving Alliance tracks spending by charities, it stands to reason that IEA’s spending of less than 13% on representation – the purpose of a union – should be a cause for concern among members.
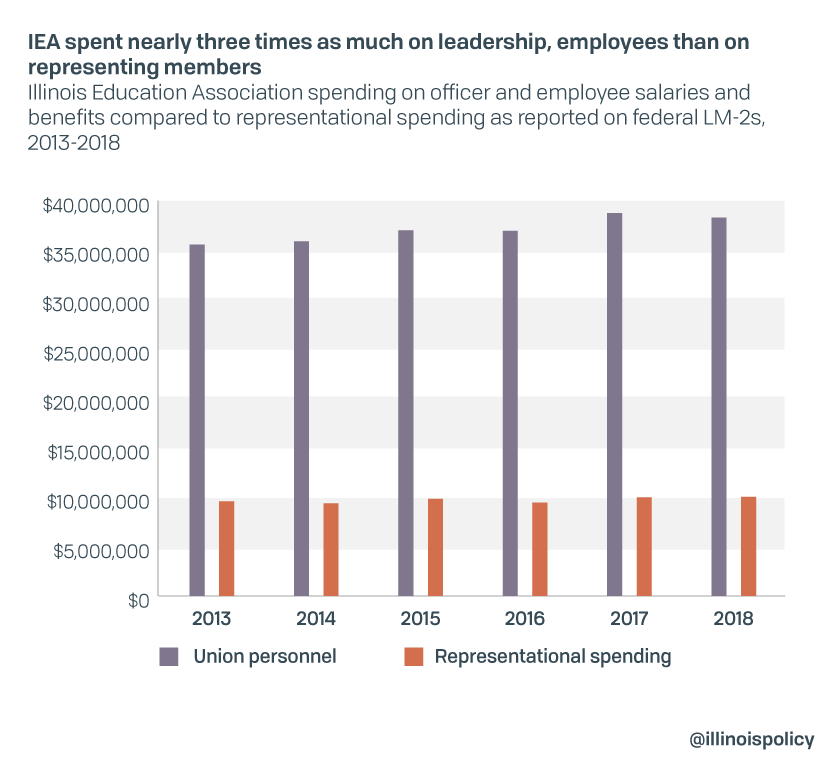
Spending on leadership: IEA spent almost 3 times as much on its own officers and employees than it did on representing members
IEA reported it spent $16.2 million a year on average for officer and employee salaries for tasks unrelated to representational activities in 2013-2018.24
It spent an additional $12.4 million a year on benefits for its own officers and employees.25
Combined, IEA spent nearly $29 million on its own leadership and employees, which is almost three times as much as it did on representing members.
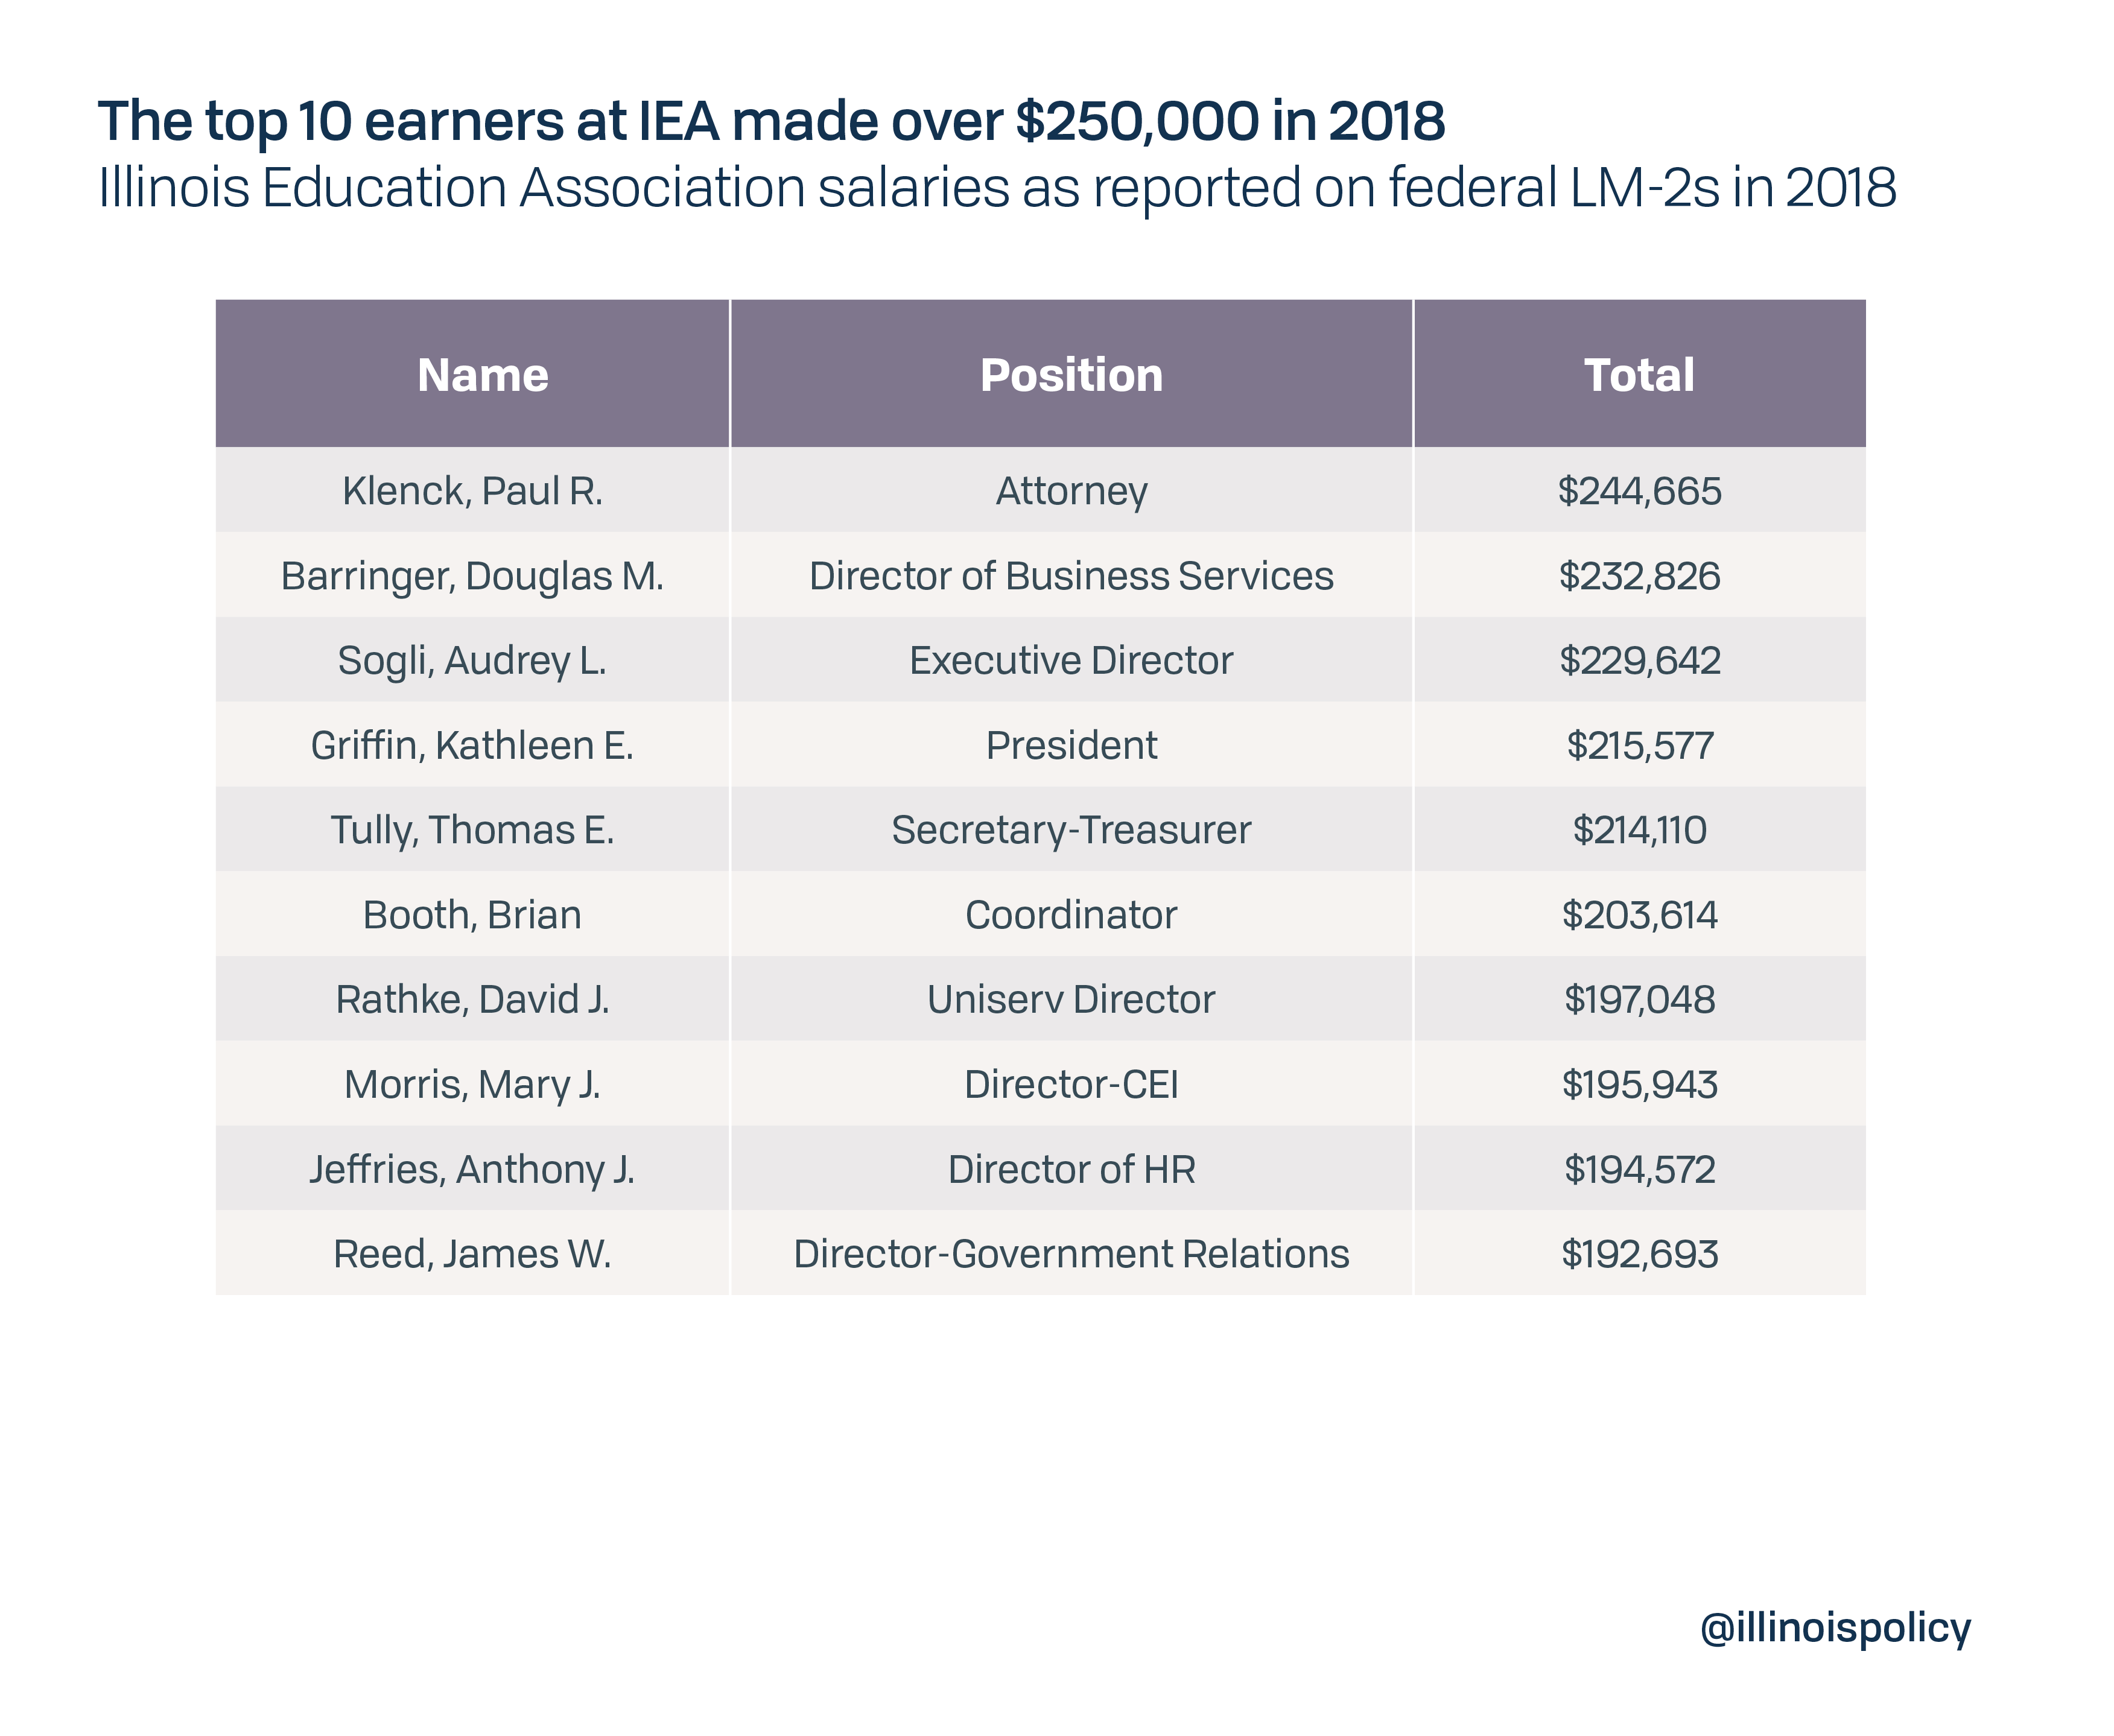
And while Illinois public school educators make less than $66,000 a year on average,26 the top 10 earners at IEA each made over $190,000 in 2018 – with the top six clearing $200,000.
Spending on affiliates: IEA directed twice as much money to affiliates in Chicago and Chicago-area suburbs than it did to affiliates south of I-80
Between 2013 and 2018, IEA disbursed $7.7 million to its local affiliates in Chicago and the Chicago suburbs.27
Yet it disbursed just $3 million to local affiliates south of Interstate 80.28
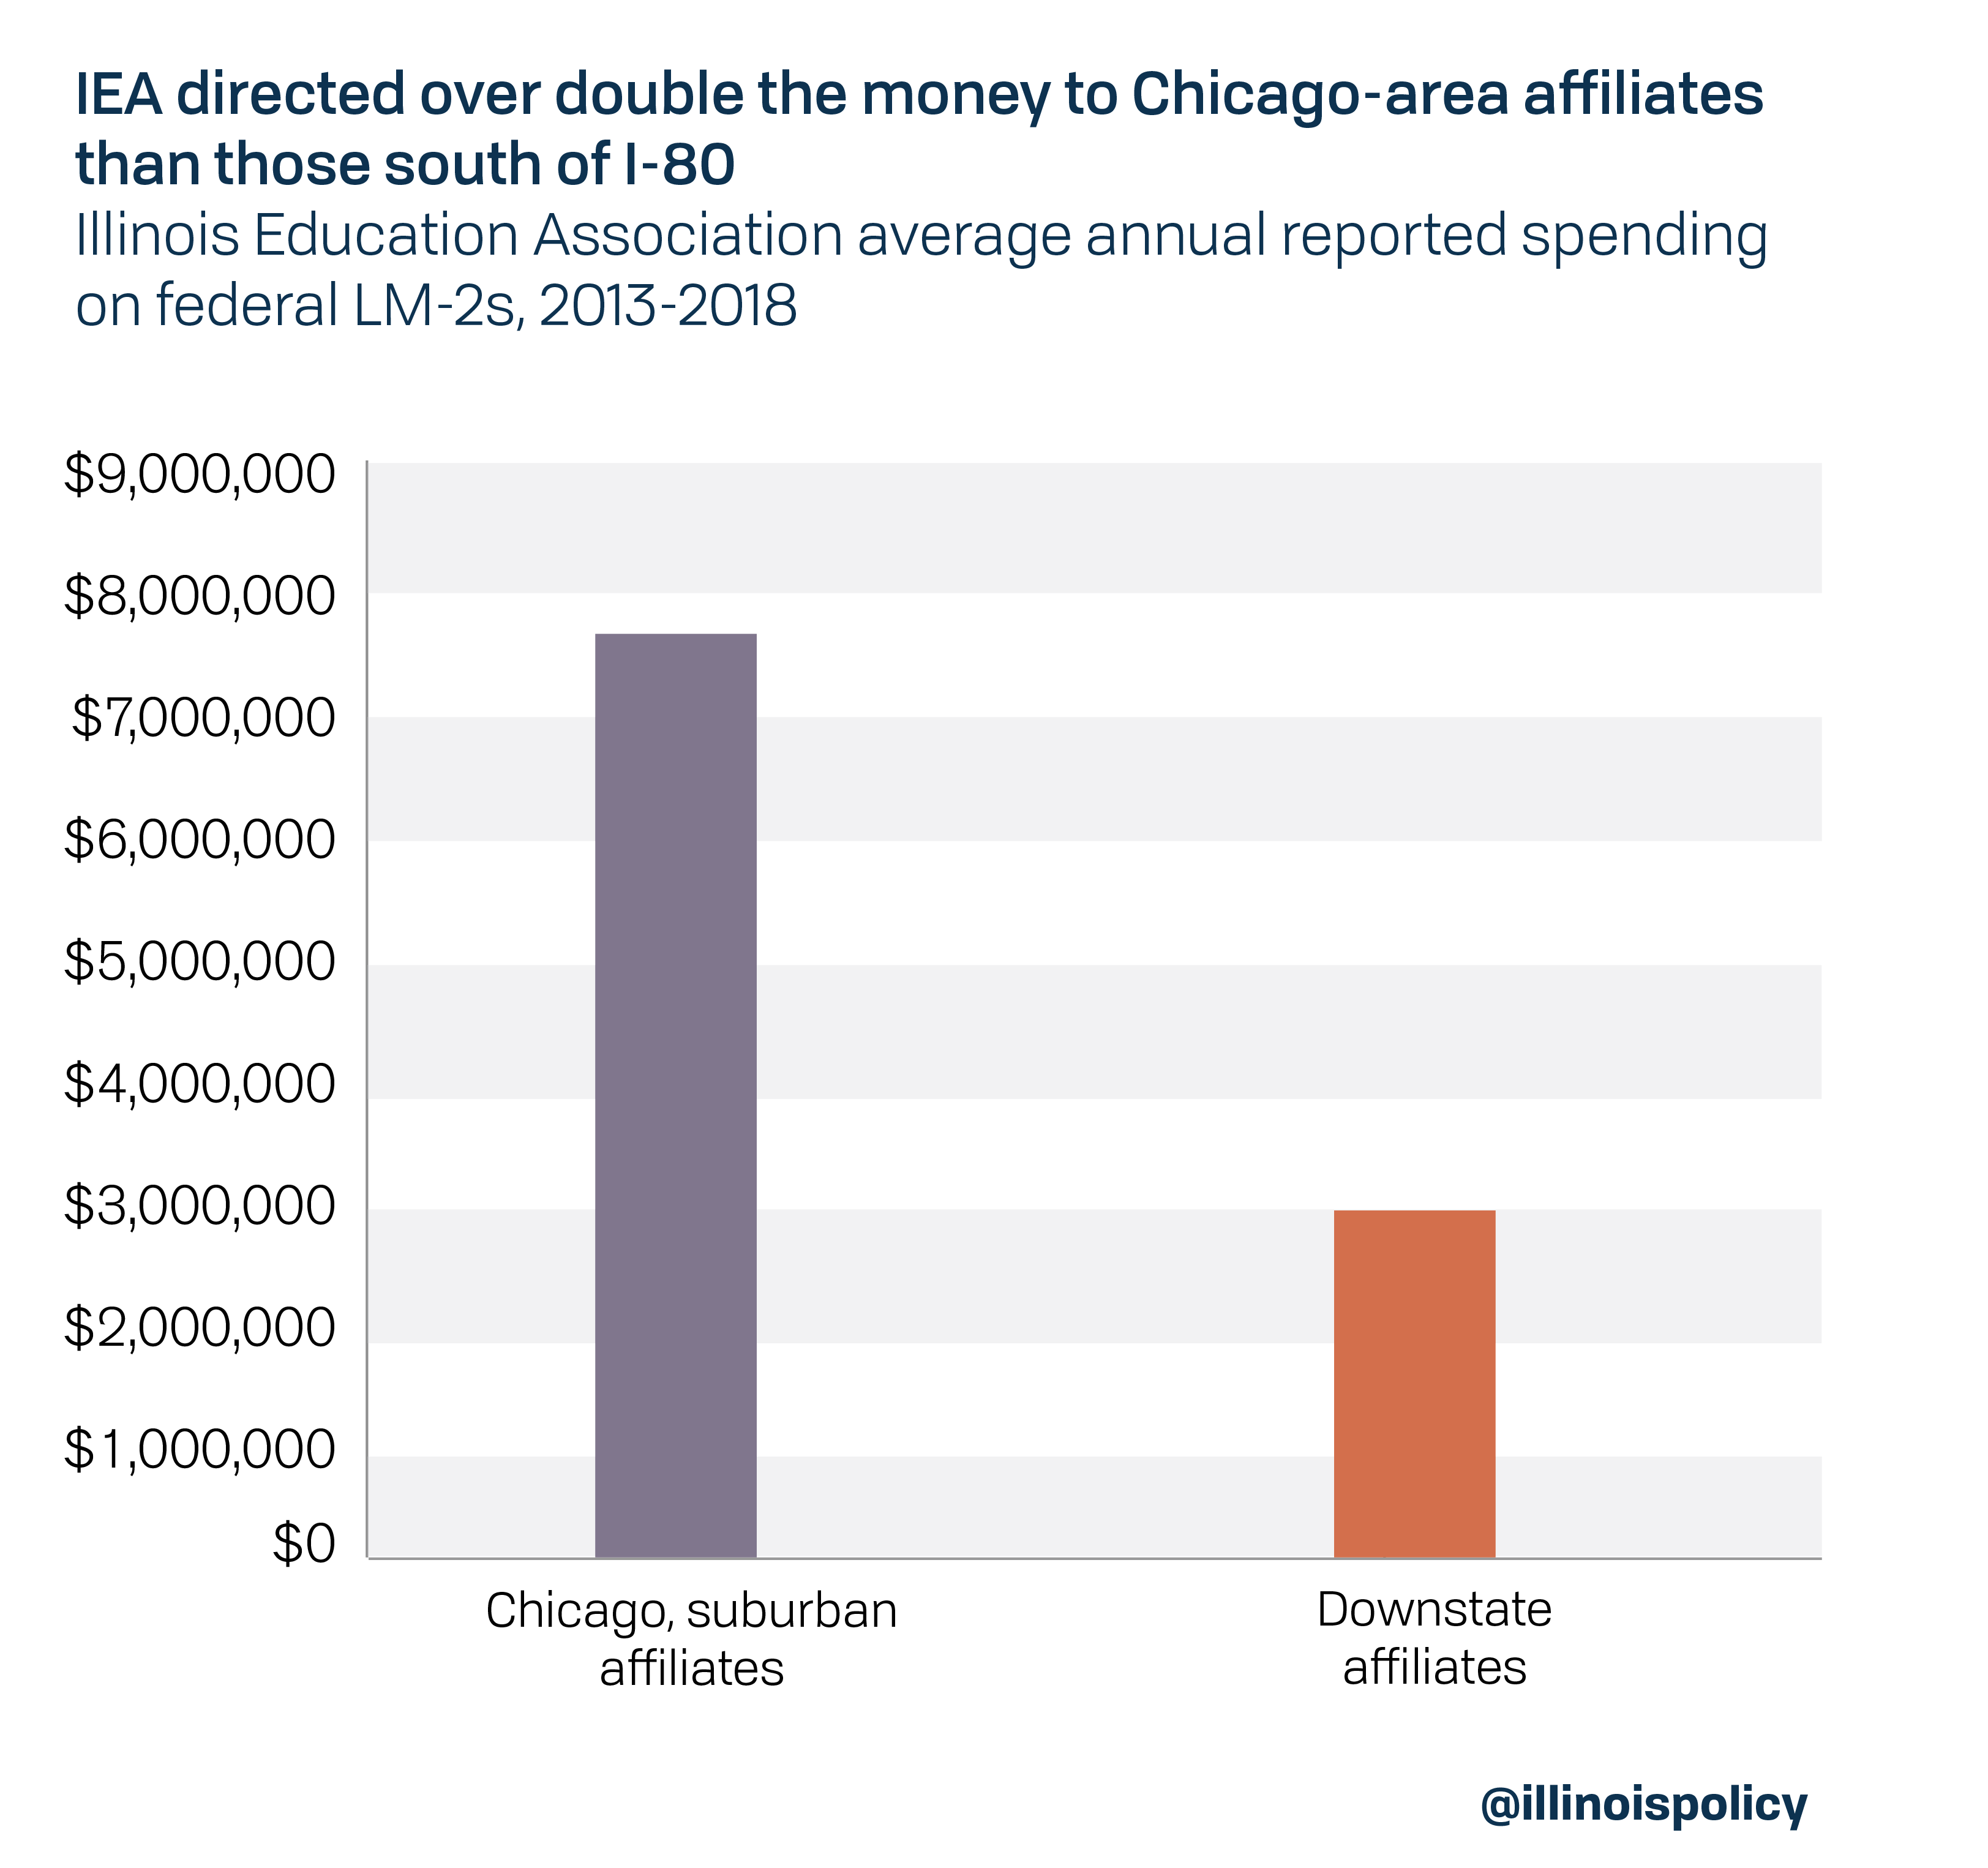
While teachers in downstate Illinois sent thousands of dollars up the chain to IEA, they saw the majority of IEA’s affiliate spending flow to the Chicagoland area.
Political spending: IEA spent more than $1.4 million a year on average on political activities and other contributions
IEA reported spending $6.6 million on “political activities and lobbying” between 2013 and 2018, for an average of $1.1 million a year.29
In addition, it spent more than $337,000 a year on average for other contributions.30
IEA members might not have supported the causes or organizations IEA funded with their dues. At a minimum this shows IEA prioritized politics and contributions over representing workers or other member-targeted projects.
Questionable spending: IEA spent thousands for unspecified purposes
While some disbursements in an LM-2 are attributed to things such as membership meetings, member education, conventions or other purposes, many are not. That’s because unions do not have to itemized disbursements that fall below $5,000.31 A recipient is listed, but the exact reason for the disbursement is not.
Between 2013 and 2018, IEA spent the following for unspecified purposes:
- Almost $1 million on hotels
- Over $260,000 to political action committees, which can then disburse funds in any way they want.32
Because these disbursements were non-itemized, there is no way for members to evaluate whether the spending was appropriate. Members cannot hold union leadership accountable.
American Federation of Teachers (AFT)
Between 2013 and 2018, AFT spent almost $2 billion, or an average of $332 million a year.33
Its members have a right to know how the union prioritized that spending during that period.
Representational spending: Only 22% of AFT spending was for representational activities
AFT reported it spent just $73.9 million a year on average for representational activities34 – those activities related to negotiating collective bargaining agreements and the administration and enforcement of agreements.35
That means just 22% – or 22 cents of every $1 – of AFT’s total spending each year was directed toward representing its members.
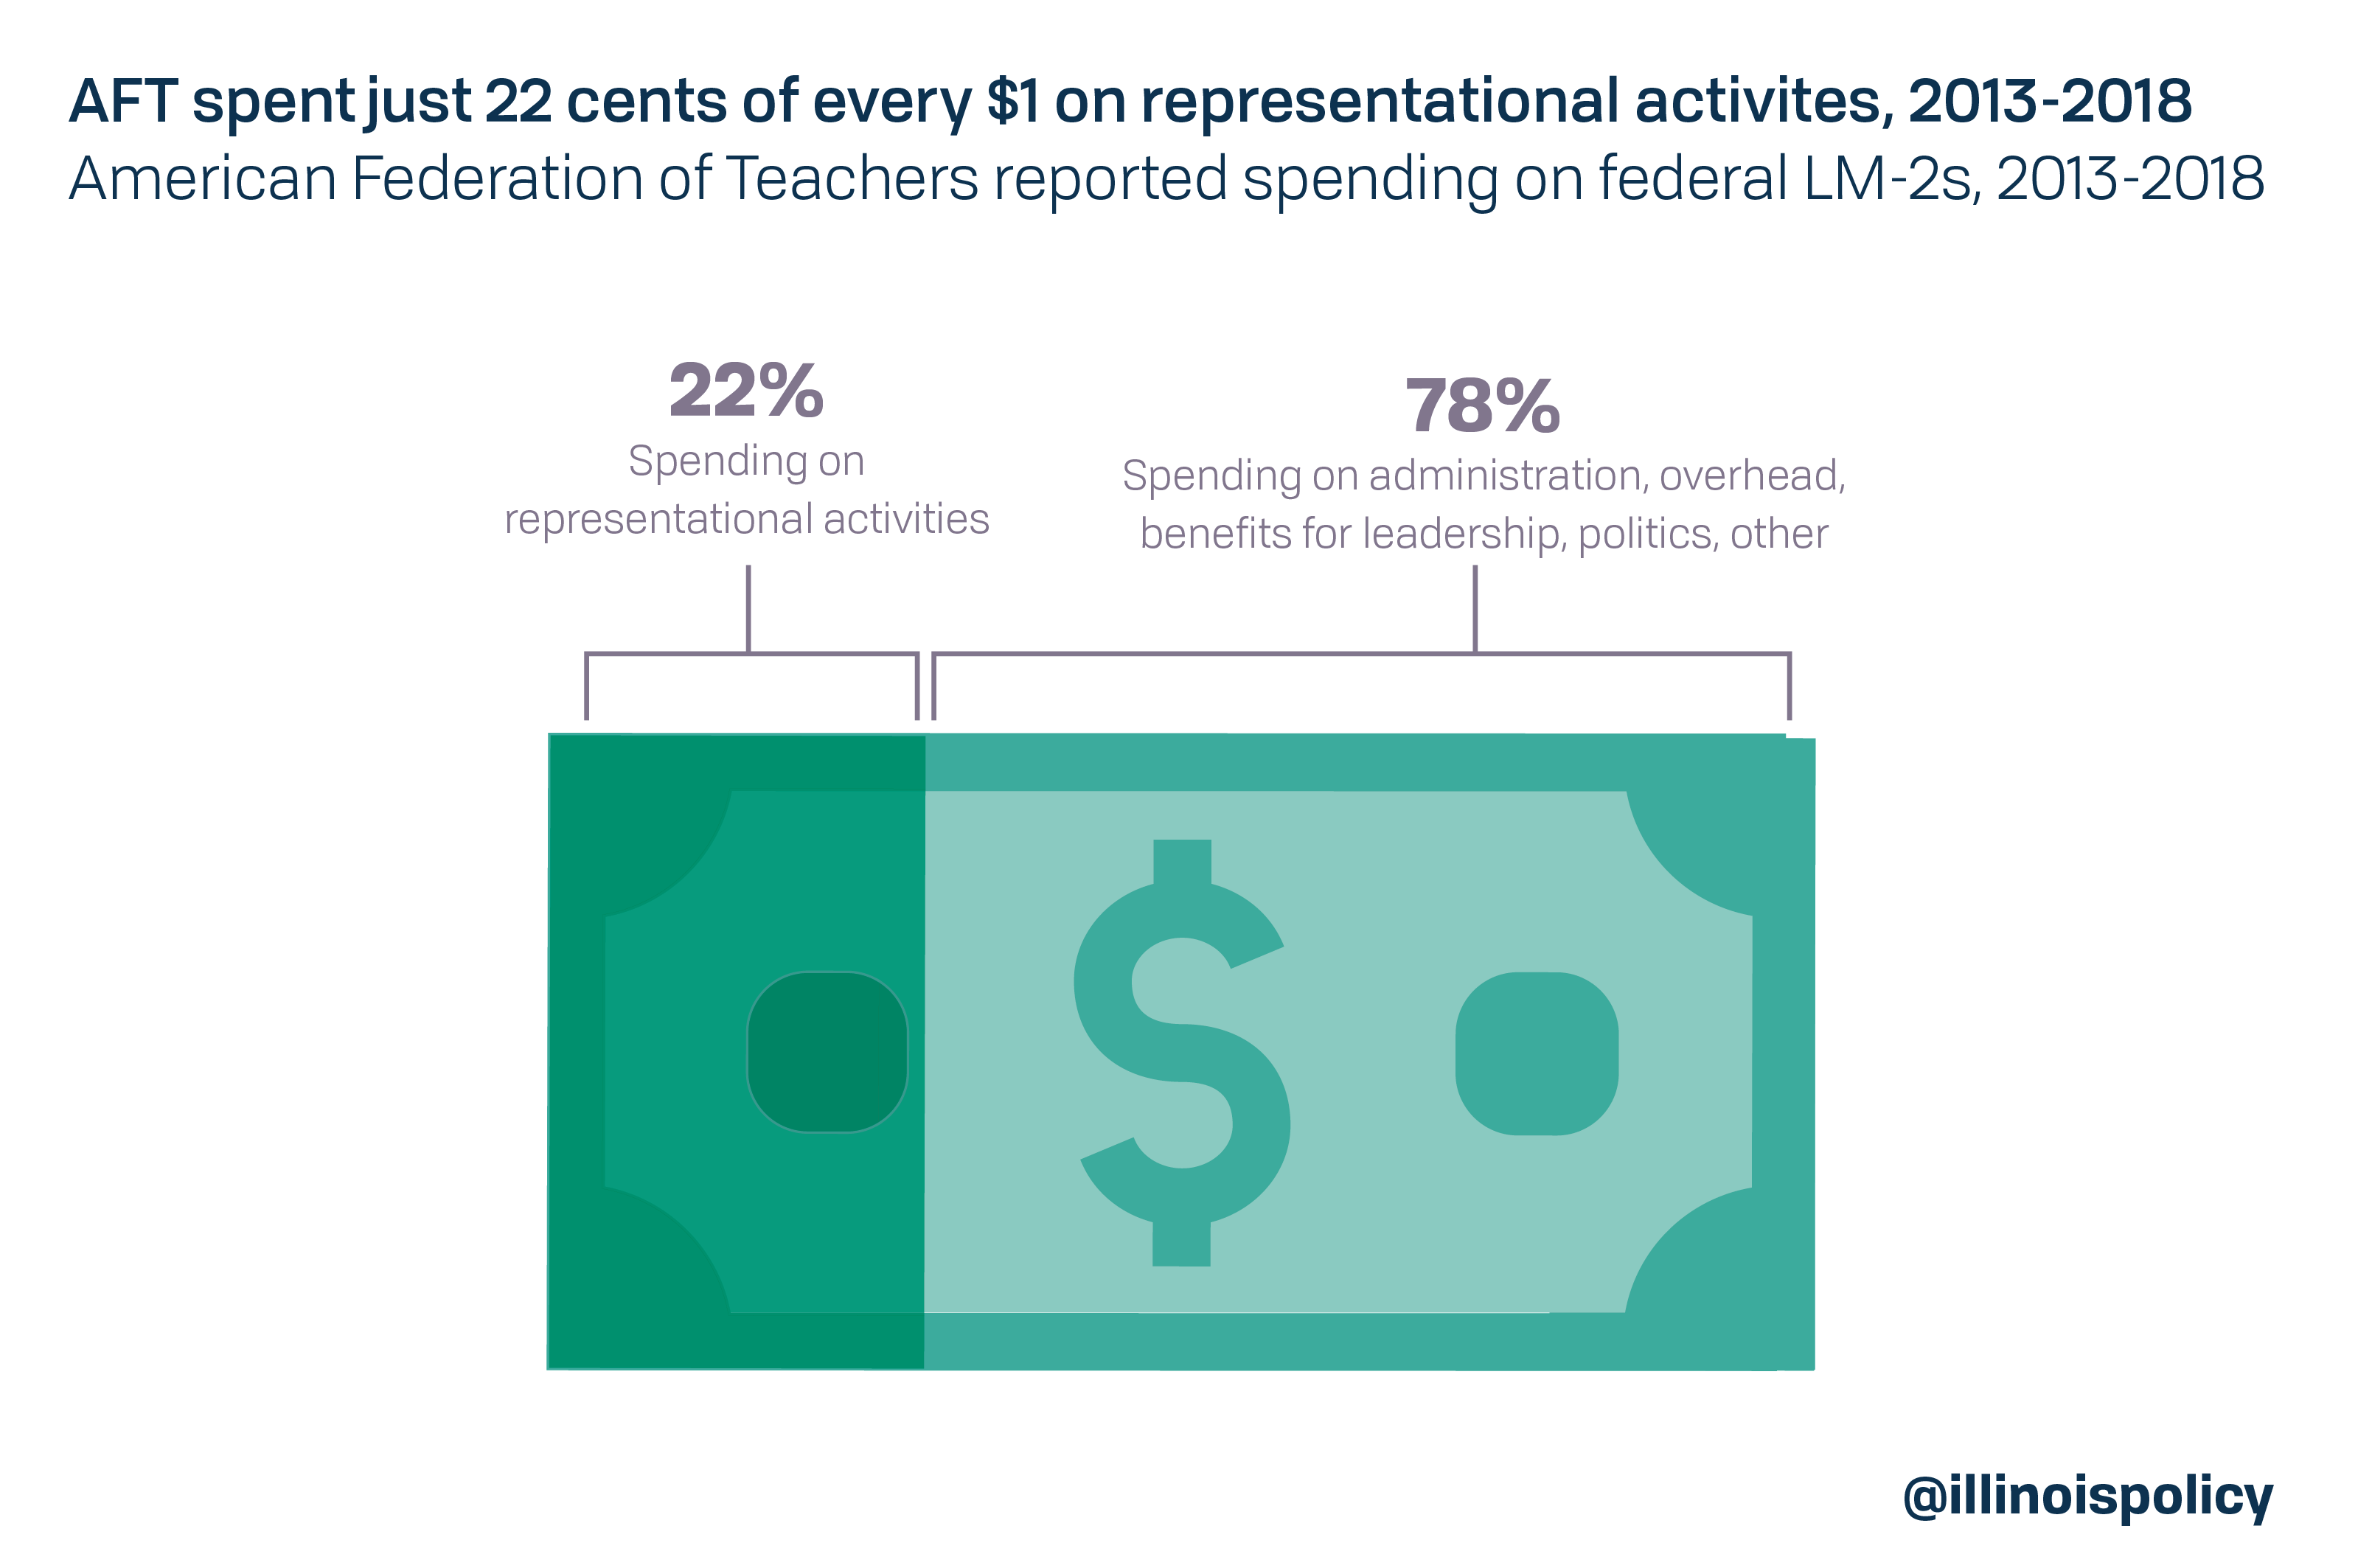
AFT spent the rest on things such as administration, overhead, benefits for the union’s own officers and employees, and politics.
To place this in perspective, the Wise Giving Alliance, a project of the Better Business Bureau, maintains a nonprofit should spend at least 65% of its total expenses on program activities.36
While the Wise Giving Alliance tracks spending by charities, it stands to reason that AFT’s spending of just 22% on representation – the purpose of a union – should be a cause for concern among members.
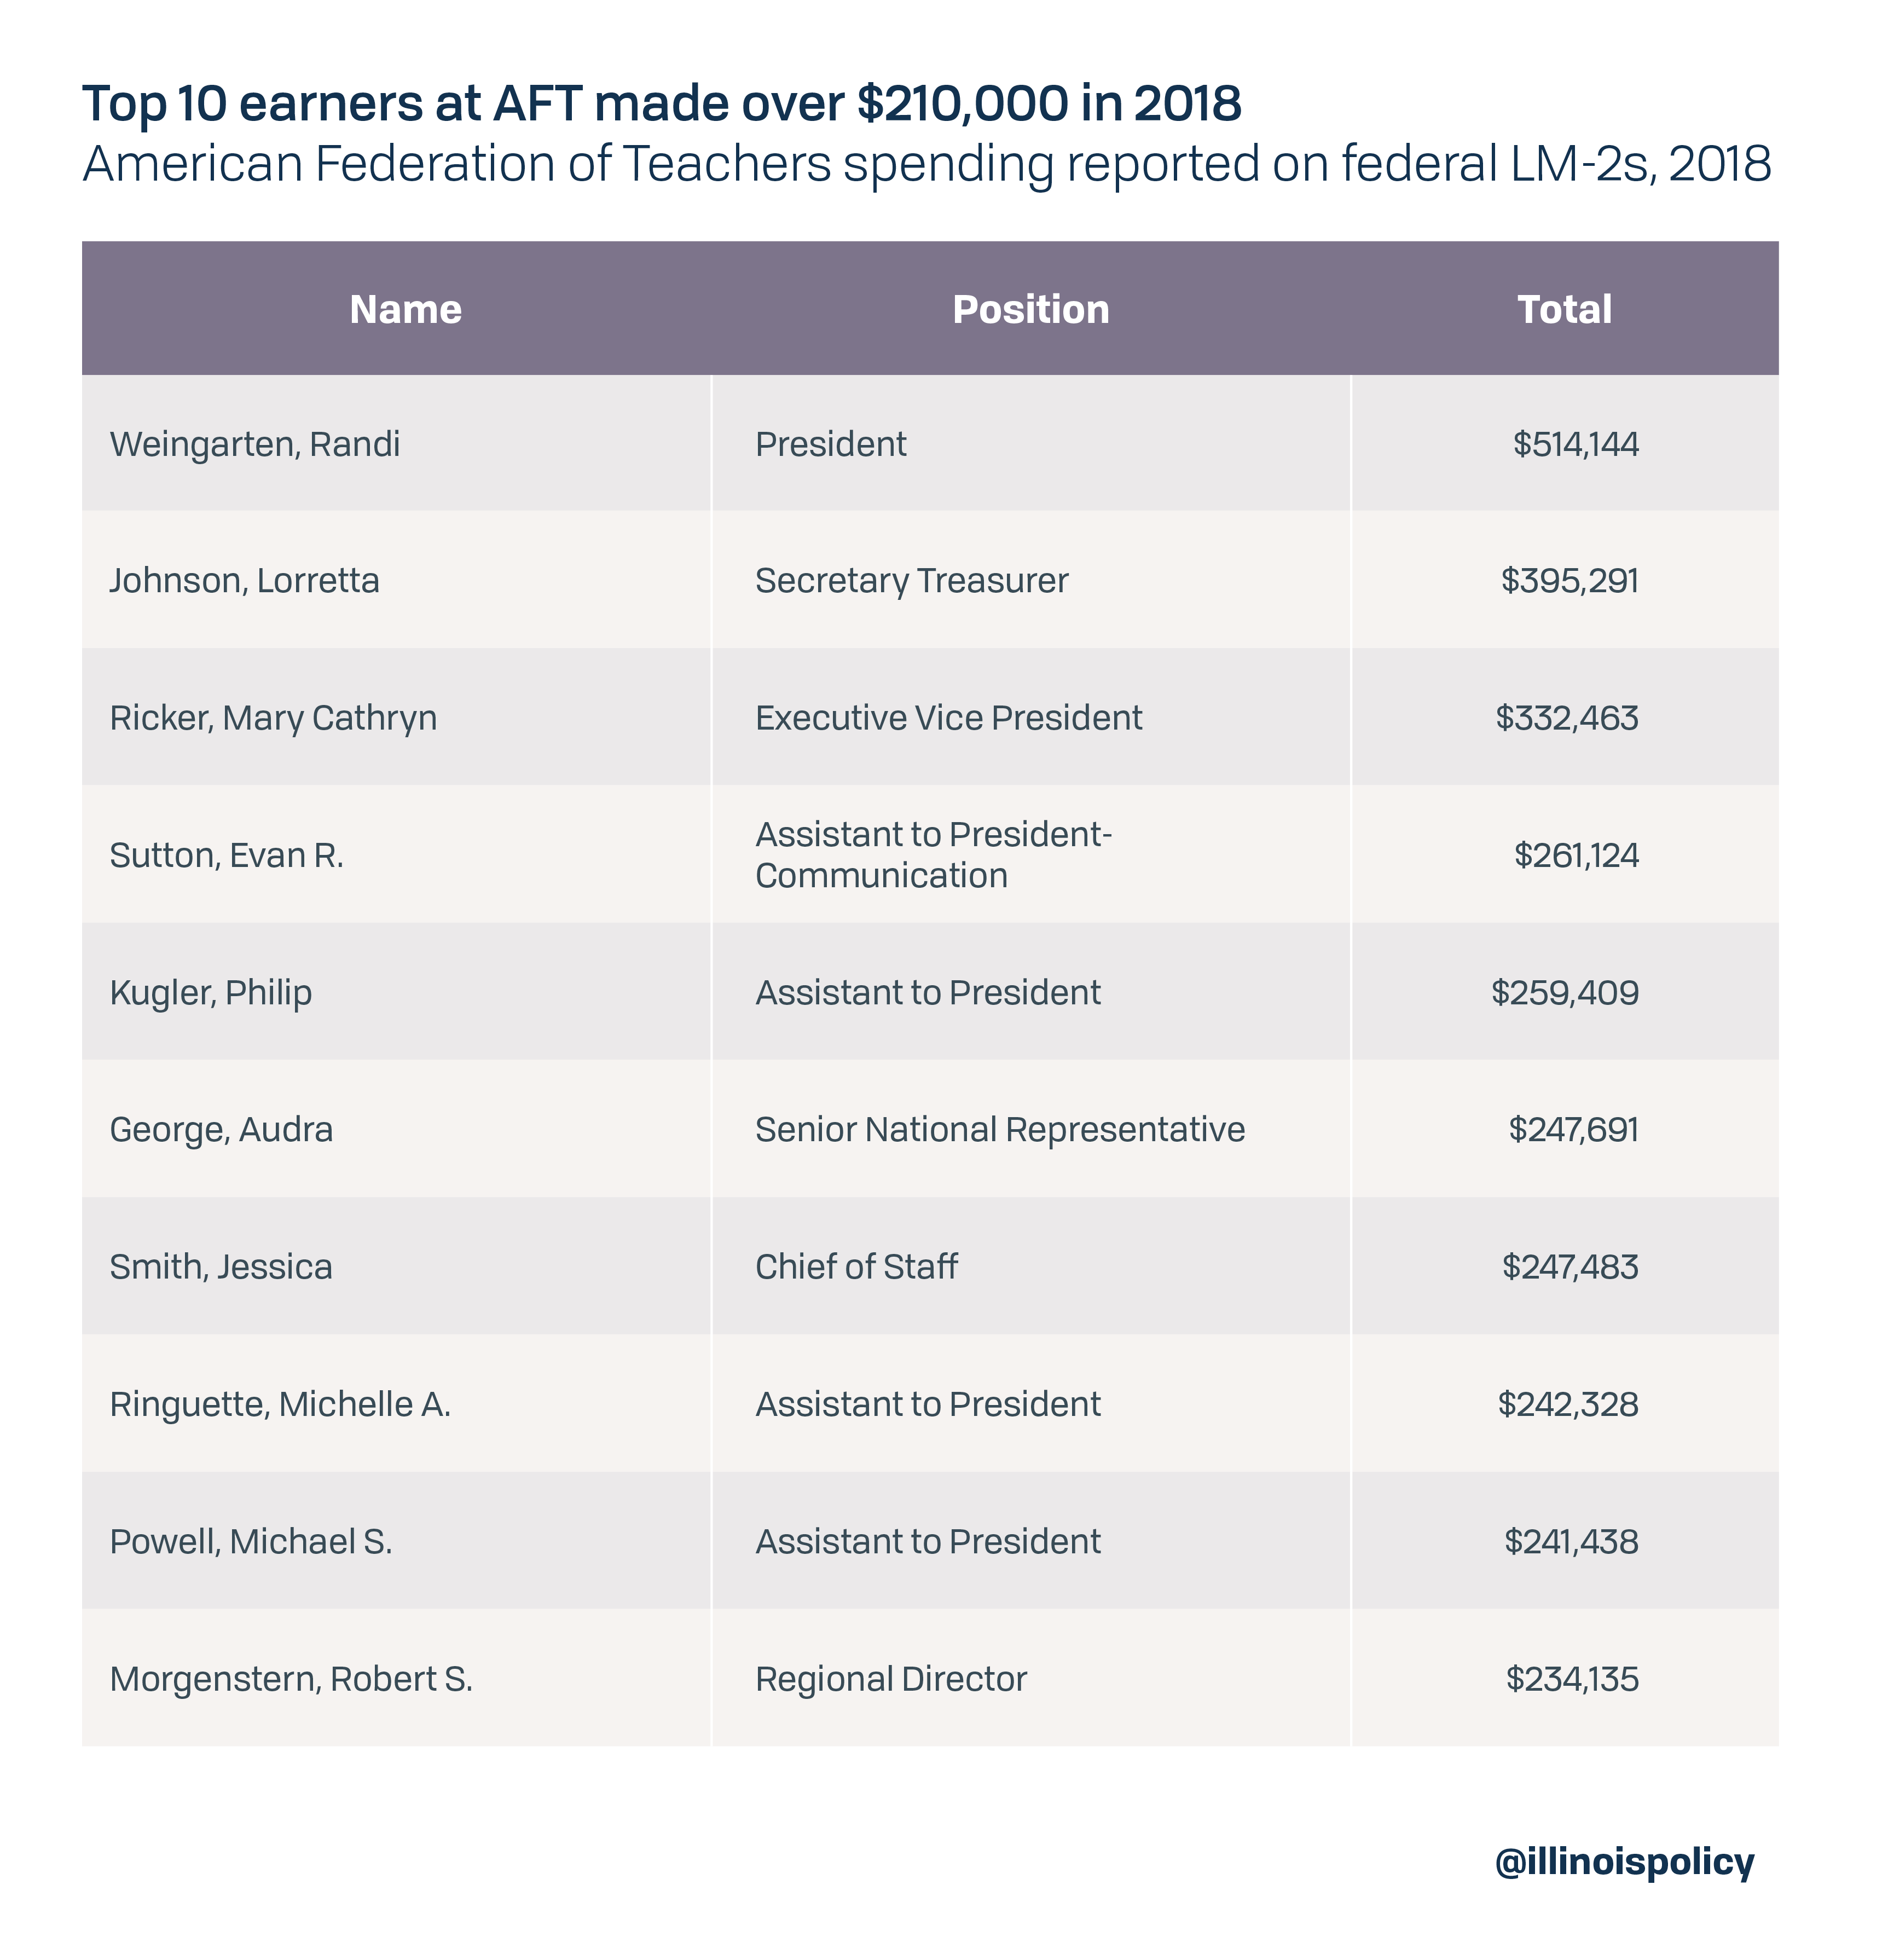
Spending on leadership: AFT spent almost $43 million a year on its own officers and employees
AFT reported it spent $25.5 million a year on average for officer and employee salaries for tasks unrelated to representational activities in 2013-2018.37
It spent an additional $17.4 million a year on benefits for its own officers and employees.38
That doesn’t include money AFT spent on executive meetings. For example, the union spent $443,309 on hotels in 2018 for “executive council meeting” – including $143,646 to a hotel in Puerto Rico.
And while Illinois public school educators make less than $66,000 a year on average,39 the top 10 earners at AFT in 2018 each made over $230,000 – with AFT President Randi Weingarten taking home over $500,000 a year.40
Spending on affiliates: Less than 5% of funds AFT sent to affiliates went to affiliates in Illinois
Between 2013 and 2018, AFT disbursed $240.3 million to its state and local affiliates.41
Yet less than $12 million – just 5% – went to affiliates in Illinois.42
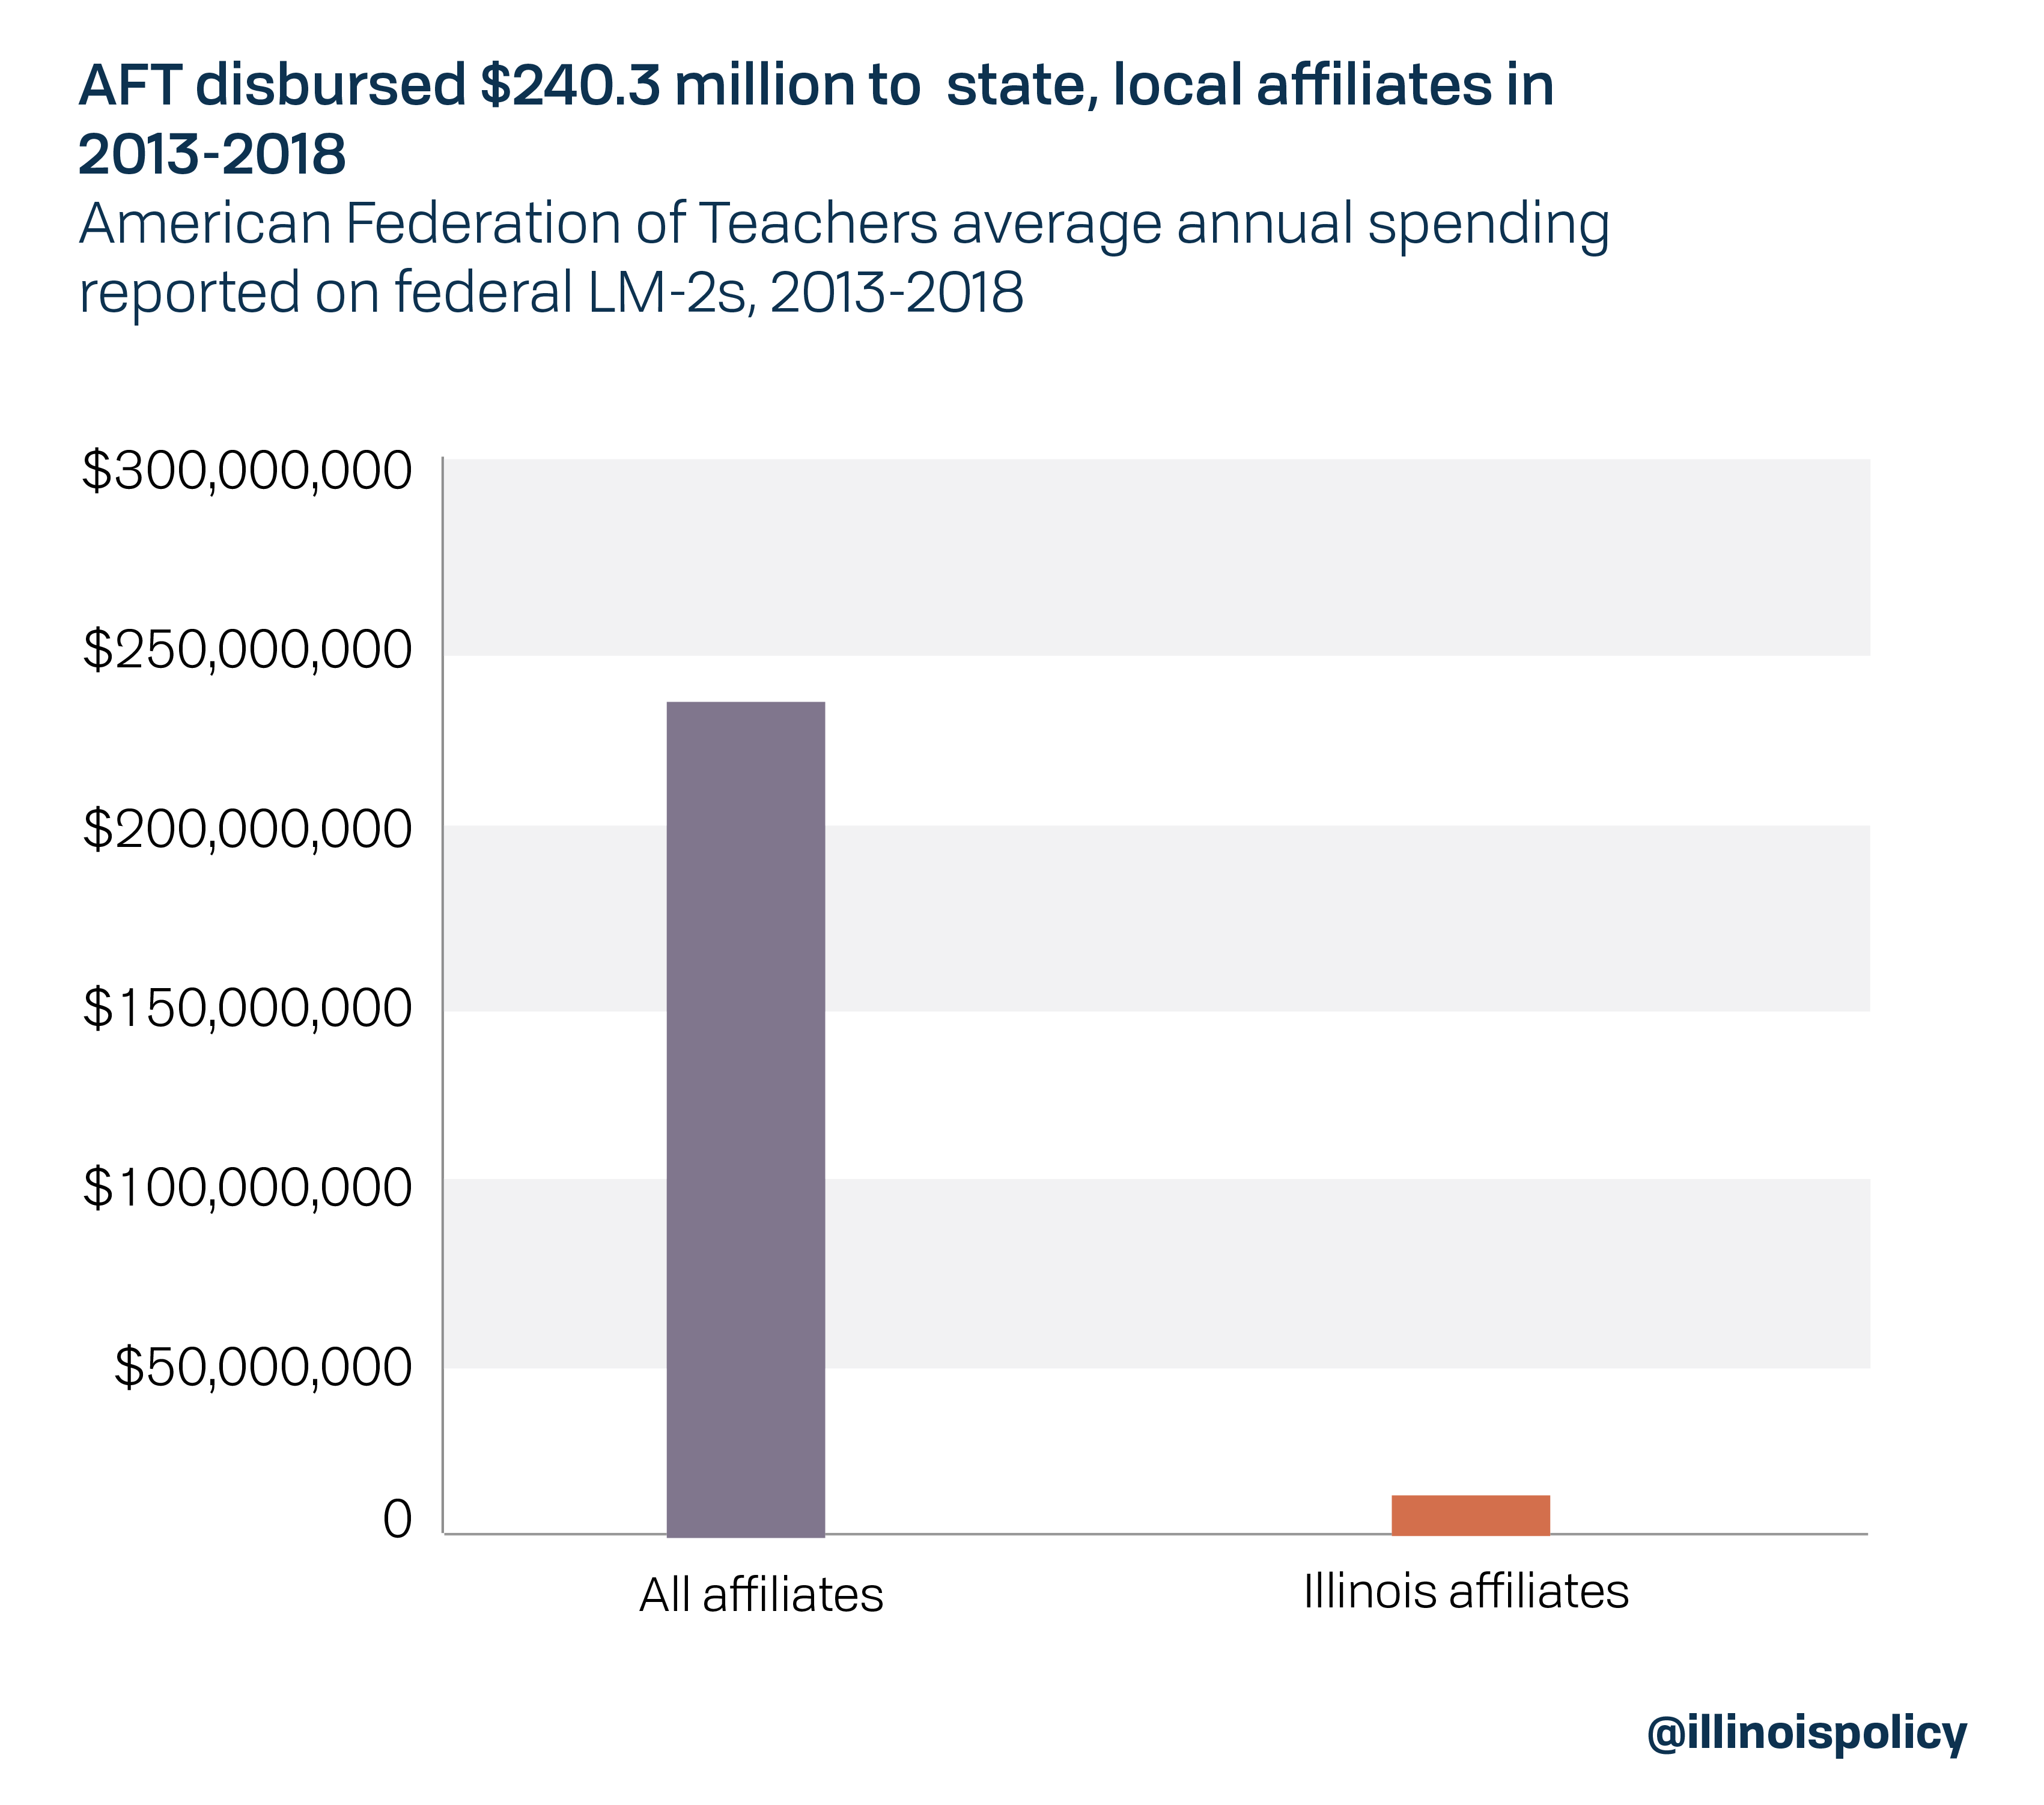
While Illinois teachers sent thousands of dollars up the chain to AFT, they saw very little come back to their own state.
Political spending: AFT spent $37 million a year on average on political activities and other contributions
AFT reported spending over $190 million on “political activities and lobbying” between 2013 and 2018, for an average of $31.8 million a year.43
It spent an additional $5.2 million a year on other contributions, many of which were political.44
Examples of AFT’s political spending and contributions in 2013-2018 include the following:
- $2.2 million to Bill, Hillary & Chelsea Clinton Foundation and Clinton Global Initiative
- More than $2.4 million to its own political account, which could then disburse the money in any way it wanted
- $17.5 million to self-proclaimed “progressive organizations.”
AFT members might not have supported the causes or organizations AFT funded with their dues. At a minimum this shows AFT prioritized politics and contributions over representing workers or other member-targeted projects.
Questionable non-itemized spending: AFT spent millions on travel and restaurants for unspecified purposes
Some disbursements in an LM-2 are not itemized, which means they are not attributed to things such as membership meetings, member education, conventions or other purposes. A recipient is listed, but the exact reason for the disbursement is not.
Between 2013 and 2018, AFT spent the following for unspecified purposes:
- $20,494,930 for airlines
- $4,014,923 for hotels, conferences and lodging
- $872,213 for train travel
- $2,623,862 for other transportation
- $172,004 for a travel agency
- $63,030 for catering and restaurants
Because these disbursements were non-itemized, there is no way for members to evaluate whether the spending was appropriate. Members cannot hold union leadership accountable.
Illinois Federation of Teachers (IFT)
Between 2013 and 2018, IFT spent more than $262 million, at an average of $43.7 million a year.45
Its members have a right to know how the union prioritized that spending during those six years.
Representational spending: Just 25% of IFT spending was for representational activities
IFT reported it spent just $11.1 million a year on average for representational activities46 – those activities related to negotiating collective bargaining agreements and the administration and enforcement of agreements.47
That means 25% – or just 25 cents of every $1 – of IFT’s total spending each year was directed toward representing its members.
IFT spent the rest on things such as administration, overhead, benefits for the union’s own officers and employees, and politics.
To place this in perspective, the Wise Giving Alliance, a project of the Better Business Bureau, maintains a nonprofit should spend at least 65% of its total expenses on program activities.48
While the Wise Giving Alliance tracks spending by charities, it stands to reason that IFT’s spending of less than 25% on representation – the purpose of a union – should be a cause for concern among members.
Spending on leadership: IFT spent nearly as much on its own salaries and benefits as it did on representing workers
IFT reported it spent $5.3 million a year on average for officer and employee salaries for tasks unrelated to representational activities in 2013-2018.49
It spent an additional $4 million a year on average on benefits for its own officers and employees.50
Altogether, that’s $9.3 million a year on salaries and benefits unrelated to representational activities – nearly as much as the $11.1 million a year it spent on representing workers.
What’s more, IFT spent almost $1 million on hotels and catering for executive board, leadership and staff events during 2013-2018.51
And while Illinois public school educators make less than $66,000 a year on average,52 the top 10 earners at IFT each made over $190,000 in 2018, with president Dan Montgomery taking home more than $230,000.53
Spending on affiliates: IFT directed 57 times more money to Chicago-area affiliates than it did to its affiliates south of I-80
IFT reported it disbursed $22.6 million to its affiliates in Chicago and Chicago-area suburbs from 2013-2018.54 Yet it disbursed just $396,000 to all affiliates south of Interstate 80.55
In other words, IFT disbursed $3.8 million a year to its Chicago-area affiliates – which is 57 times more than the mere $67,000 a year it disbursed to downstate affiliates.
That disparity grows when other northern Illinois affiliates are added to the mix. IFT disbursed $4.3 million each year on average to affiliates north of I-80, compared to the $67,000 it directed toward affiliates south of I-80.56
In fact, IFT sent more money out of state than it did to its affiliates south of I-80. Between 2013 and 2018, it reported disbursing over $2.4 million to AFT and non-Illinois affiliates of AFT, compared to the $396,000 it sent to downstate Illinois affiliates.
While Illinois teachers are sending thousands of dollars up the chain to IFT, those in downstate Illinois are seeing a pittance come back to their own bargaining units.
Political spending: IFT spent more than $1 million a year on average on political activities and other contributions
IFT reported spending more than $5.8 million on “political activities and lobbying” between 2013 and 2018, for an average of nearly $973,000 a year.57
In addition, it spent more than $32,750 a year on average for other contributions.58
IFT members might not have supported the causes or organizations IFT funded with their dues. At a minimum this shows IFT prioritized politics and contributions over representing workers or other member-targeted projects.
Questionable spending: IFT spent thousands of dollars for unspecified purposes
Some disbursements in an LM-2 are not itemized, which means they are not attributed to things such as membership meetings, member education, conventions or other purposes. A recipient is listed, but the exact reason for the disbursement is not.
Between 2013 and 2018, IFT spent the following for unspecified purposes:
- $150,404 for hotels, catering and restaurants
- $59,706 to a theater
Because these disbursements were non-itemized, there is no way for members to evaluate whether the spending was appropriate. Members cannot hold union leadership accountable.
Conclusion
Teachers union dues don’t stay with local bargaining units. In fact, a significant portion of most unions’ dollars are passed up the chain to state and national affiliates, where members have little say in how that money is spent.
The unions’ LM-2 forms – federal reports filed in the unions’ own words – shed light on the patterns, practices and priorities of union leadership.
Those documents reveal union leadership does not prioritize representation of its members in Illinois.
Illinois educators who want more control over their dues money do have options:
- Teachers can join a union alternative, such as the Association of American Educators. AAE, which has over 22,000 members across the country, provides liability insurance and job protection coverage to public school employees – often at a fraction of the cost of union membership.
- Teachers can opt out of union membership. By opting out of union membership, a teacher stops paying dues to the union but retains all benefits that are provided in the collective bargaining agreement with the school district.
Opting out doesn’t mean educators don’t support their local bargaining unit. In fact, educators are free to send voluntary donations to their local union without being a member – thereby ensuring support stays local.
For more information or to opt out online, visit www.leaveiea.com for IEA, or www.leaveift.com for IFT.
Appendix
Endnotes
- Information obtained from Bloomington Public Schools District 87 via Freedom of Information Act request by Illinois Policy Institute.
- Only unions that take in $250,000 or more a year and represent private employees, U.S. Postal Service employees or most federal government employees must file an LM-2. United States Department of Labor, “Reports required under the LMRDA and the CSRA.” The National Education Association, Illinois Education Association, American Federation of Teachers and Illinois Federation of Teachers must file LM-2s because they take in $250,000 or more a year and represent some workers in the private sector. See United States Department of Labor, “Instructions for form LM-2 labor organization annual report,” November 2010.
- LM-2s are not without flaws. Unions are given great discretion in how they categorize spending. What’s more, unions do not have to itemize spending that falls below $5,000. See United States Department of Labor, “Instructions for form LM-2 labor organization annual report,” November 2010. Yet LM-2s provide insight into union spending because they provide a look into the union’s own accounting.
- See Appendix; National Education Association, 2018 LM-2 (reporting $357,281,199 in total spending); National Education Association, 2017 LM-2 (reporting $387,566,687 in total spending); National Education Association, 2016 LM-2 (reporting $387,226,823 in total spending); National Education Association, 2015 LM-2 (reporting $362,981,380 in total spending); National Education Association, 2014 LM-2 (reporting $352,847,522 in total spending); National Education Association, 2013 LM-2 (reporting $344,403,457 in total spending).
- See Appendix; National Education Association, 2018 LM-2 (reporting $42,485,096 on “representational activities”); National Education Association, 2017 LM-2 (reporting $43,704,842 on “representational activities”); National Education Association, 2016 LM-2 (reporting $46,503,911 on “representational activities”); National Education Association, 2015 LM-2 (reporting $48,236,412 on “representational activities”); National Education Association, 2014 LM-2 (reporting $44,915,308 on “representational activities”); National Education Association, 2013 LM-2 (reporting $44,287,632 on “representational activities”).
- These activities are defined by the U.S. Department of Labor as “the labor organization’s direct and indirect disbursements to all entities and individuals during the reporting period associated with preparation for, and participation in, the negotiation of collective bargaining agreements and the administration and enforcement of the agreements made by the labor organization.” United States Department of Labor, “Instructions for form LM-2 labor organization annual report,” November 2010. It also includes activities related to organizing a unit or warding off a decertification.
- BBB Wise Giving Alliance, “Governance and oversight.”
- Unions are required to report the percentage of each employee’s salary that represents the portion of their work devoted to “representational activities.” That means we can calculate how much of an officer’s or employee’s pay was not for tasks related to representational activities. See National Education Association, 2018 LM-2 (reporting $73,507,754 in Schedules 11 and 12 with $14,244,794 spent on “representational activities” according to Detailed Summary Page – Schedules 14 through 19); National Education Association, 2017 LM-2 (reporting $74,727,582 in Schedules 11 and 12 with $14,954,392 spent on “representational activities” according to Detailed Summary Page – Schedules 14 through 19); National Education Association, 2016 LM-2 (reporting $77,758,651 in Schedules 11 and 12 with $15,626,972 spent on “representational activities” according to Detailed Summary Page – Schedules 14 through 19); National Education Association, 2015 LM-2 (reporting $74,200,423 in Schedules 11 and 12 with $15,946,155 spent on “representational activities” according to Detailed Summary Page – Schedules 14 through 19); National Education Association, 2014 LM-2 (reporting $70,629,355 in Schedules 11 and 12 with $14,606,258 spent on “representational activities” according to Detailed Summary Page – Schedules 14 through 19); National Education Association, 2013 LM-2 (reporting $70,646,282 in Schedules 11 and 12 with $13,152,790 spent on “representational activities” according to Detailed Summary Page – Schedules 14 through 19).
- See Appendix; National Education Association, 2018 LM-2 (reporting $60,742,225 in benefits); National Education Association, 2017 LM-2 (reporting $62,653,532 in benefits); National Education Association, 2016 LM-2 (reporting $54,212,255 in benefits); National Education Association, 2015 LM-2 (reporting $60,014,729 in benefits); National Education Association, 2014 LM-2 (reporting $61,416,205 in benefits); National Education Association, 2013 LM-2 (reporting $66,129,737 in benefits).
- Illinois State Board of Education, “Illinois Report Card 2017-2018,” State Snapshot.
- National Education Association, 2013-2018 LM-2s.
- National Education Association, 2013-2018 LM-2s.
- See Appendix; National Education Association, 2018 LM-2 (reporting $26,746,513 for “political activities and lobbying” and $107,993,065 for “contributions, gifts, and grants”); National Education Association, 2017 LM-2 (reporting $53,306,556 for “political activities and lobbying” and $97,824,622 for “contributions, gifts, and grants”); National Education Association, 2016 LM-2 (reporting $43,029,434 for political activities and lobbying” and $95,232,554 for “contributions, gifts, and grants”); National Education Association, 2015 LM-2 (reporting $40,988,442 for “political activities and lobbying” and $90,375,753 for “contributions, gifts, and grants”); National Education Association, 2014 LM-2 (reporting $31,419,232 for “political activities and lobbying” and $100,711,521 for “contributions, gifts, and grants”); National Education Association, 2013 LM-2 (reporting $44,797,771 for “political activities and lobbying” and $86,253,733 for “contributions, gifts, and grants”).
- These disbursements include “the labor organization’s direct and indirect disbursements to all entities and individuals during the reporting period associated with political disbursements or contributions in money.” United States Department of Labor, “Instructions for form LM-2 labor organization annual report,” November 2010.
- These disbursements include “the labor organization’s direct and indirect disbursements to all entities and individuals during the reporting period associated with contributions, gifts, and grants” that aren’t reported elsewhere in the LM-2. United States Department of Labor, “Instructions for form LM-2 labor organization annual report,” November 2010. Many disbursements categorized as a “contribution” are political in nature.
- National Education Association, 2013-2018 LM-2s.
- See United States Department of Labor, “Instructions for form LM-2 labor organization annual report,” November 2010. Yet LM-2s provide insight into union spending because they provide a look into the union’s own accounting.
- National Education Association, 2013-2018 LM-2s (reporting non-itemized disbursements in Schedules 15-19).
- Illinois Education Association, 2018 LM-2 (reporting 137,097 members).
- See Appendix; Illinois Education Association, 2018 LM-2 (reporting $77,827,294 in total spending); Illinois Education Association, 2017 LM-2 (reporting $77,318,557 in total spending); Illinois Education Association, 2016 LM-2 (reporting $75,277,329 in total spending); Illinois Education Association, 2015 LM-2 (reporting $76,383,370 in total spending); Illinois Education Association, 2014 LM-2 (reporting $74,227,509 in total spending); Illinois Education Association, 2013 LM-2 (reporting $72,883,898 in total spending).
- See Appendix; Illinois Education Association, 2018 LM-2 (reporting $10,028,680 on “representational activities”); Illinois Education Association, 2017 LM-2 (reporting $9,984,579 on “representational activities”); Illinois Education Association, 2016 LM-2 (reporting $9,439,086 on “representational activities”); Illinois Education Association, 2015 LM-2 (reporting $9,828,202 on “representational activities”); Illinois Education Association, 2014 LM-2 (reporting $9,359,321 on “representational activities”); Illinois Education Association, 2013 LM-2 (reporting $9,577,009 on “representational activities”).
- These activities are defined by the U.S. Department of Labor as “the labor organization’s direct and indirect disbursements to all entities and individuals during the reporting period associated with preparation for, and participation in, the negotiation of collective bargaining agreements and the administration and enforcement of the agreements made by the labor organization.” United States Department of Labor, “Instructions for form LM-2 labor organization annual report,” November 2010. It also includes activities related to organizing a unit or warding off a decertification.
- BBB Wise Giving Alliance, “Governance and oversight.”
- Unions are required to report the percentage of each employee’s salary that represents the portion of their work devoted to “representational activities.” That means we can calculate how much of an officer’s or employee’s pay was not for tasks related to representational activities. See Illinois Education Association, 2018 LM-2 (reporting $25,112,571 on Schedules 11 and 12, with $242,448 spent on “representational activities” according to Detailed Summary Page – Schedules 14 through 19); Illinois Education Association, 2017 LM-2 (reporting $26,044,032 on Schedules 11 and 12, with $182,013 spent on “representational activities” according to Detailed Summary Page – Schedules 14 through 19); Illinois Education Association, 2016 LM-2 (reporting $24,906,582 on Schedules 11 and 12, with $246,628 spent on “representational activities” according to Detailed Summary Page – Schedules 14 through 19); Illinois Education Association, 2015 LM-2 (reporting $25,086,936 on Schedules 11 and 12, with $170,312 spent on “representational activities” according to Detailed Summary Page – Schedules 14 through 19); Illinois Education Association, 2014 LM-2 (reporting $24,213,688 on Schedules 11 and 12, with $ 186,655 spent on “representational activities” according to Detailed Summary Page – Schedules 14 through 19); Illinois Education Association, 2013 LM-2 (reporting $23,985,260 on Schedules 11 and 12, with $223,946 spent on “representational activities” according to Detailed Summary Page – Schedules 14 through 19).
- See Appendix; Illinois Education Association, 2018 LM-2 (reporting $13,400,693 in benefits); Illinois Education Association, 2017 LM-2 (reporting $12,876,040 in benefits); Illinois Education Association, 2016 LM-2 (reporting $12,290,910 in benefits); Illinois Education Association, 2015 LM-2 (reporting $12,067,292 in benefits); Illinois Education Association, 2014 LM-2 (reporting $11,845,546 in benefits); Illinois Education Association, 2013 LM-2 (reporting $11,785,105 in benefits).
- Illinois State Board of Education, “Illinois Report Card 2017-2018,” State Snapshot.
- Illinois Education Association, 2013-2018 LM-2s.
- Illinois Education Association, 2013-2018 LM-2s.
- See Appendix; Illinois Education Association, 2018 LM-2 (reporting $850,816 on “political activities and lobbying”); Illinois Education Association, 2017 LM-2 (reporting $1,188,797 on “political activities and lobbying”); Illinois Education Association, 2016 LM-2 (reporting $1,193,886 on “political activities and lobbying”); Illinois Education Association, 2015 LM-2 (reporting $1,165,295 on “political activities and lobbying”); Illinois Education Association, 2014 LM-2 (reporting $1,043,094 on “political activities and lobbying”); Illinois Education Association, 2013 LM-2 (reporting $1,167,451 on “political activities and lobbying”).
- See Appendix; Illinois Education Association, 2018 LM-2 (reporting $181,916 on “contributions, gifts, and grants”); Illinois Education Association, 2017 LM-2 (reporting $396,567 on “contributions, gifts, and grants”); Illinois Education Association, 2016 LM-2 (reporting $512,055 on “contributions, gifts, and grants”); Illinois Education Association, 2015 LM-2 (reporting $375,912 on “contributions, gifts, and grants”); Illinois Education Association, 2014 LM-2 (reporting $407,280 on “contributions, gifts, and grants”); Illinois Education Association, 2013 LM-2 (reporting $148,889 on “contributions, gifts, and grants”).
- See United States Department of Labor, “Instructions for form LM-2 labor organization annual report,” November 2010. Yet LM-2s provide insight into union spending because they provide a look into the union’s own accounting.
- Illinois Education Association, 2013-2018 LM-2s (reporting non-itemized disbursements in Schedules 15-19).
- See Appendix; American Federation of Teachers, 2018 LM-2 (reporting $341,110,739 in total spending); American Federation of Teachers, 2017 LM-2 (reporting $346,000,986 in total spending); American Federation of Teachers, 2016 LM-2 (reporting $303,648,026 in total spending); American Federation of Teachers, 2015 LM-2 (reporting $330,571,114 in total spending); American Federation of Teachers, 2014 LM-2 (reporting $334,132,440 in total spending); American Federation of Teachers, 2013 LM-2 (reporting $334,599,658 in total spending).
- See Appendix; American Federation of Teachers, 2018 LM-2 (reporting $76,103,716 on “representational activities”); American Federation of Teachers, 2017 LM-2 (reporting $75,235,673 on “representational activities”); American Federation of Teachers, 2016 LM-2 (reporting $77,641,055 on “representational activities”); American Federation of Teachers, 2015 LM-2 (reporting $73,786,000 on “representational activities”); American Federation of Teachers, 2014 LM-2 (reporting $72,554,531 on “representational activities”); American Federation of Teachers, 2013 LM-2 (reporting $68,136,270 on “representational activities”).
- These activities are defined by the U.S. Department of Labor as “the labor organization’s direct and indirect disbursements to all entities and individuals during the reporting period associated with preparation for, and participation in, the negotiation of collective bargaining agreements and the administration and enforcement of the agreements made by the labor organization.” United States Department of Labor, “Instructions for form LM-2 labor organization annual report,” November 2010. It also includes activities related to organizing a unit or warding off a decertification.
- BBB Wise Giving Alliance, “Governance and oversight.”
- Unions are required to report the percentage of each employee’s salary that represents the portion of their work devoted to “representational activities.” That means we can calculate how much of an officer’s or employee’s pay was not for tasks related to representational activities. See American Federation of Teachers, 2018 LM-2 (reporting $47,136,240 in Schedules 11 and 12 with $24,077,527 spent on “representational activities” according to Detailed Summary Page – Schedules 14 through 19); American Federation of Teachers, 2017 LM-2 (reporting $48,211,434 in Schedules 11 and 12 with $21,001,464 spent on “representational activities” according to Detailed Summary Page – Schedules 14 through 19); American Federation of Teachers, 2016 LM-2 (reporting $47,538,294 in Schedules 11 and 12 with $ 21,236,360 spent on “representational activities” according to Detailed Summary Page – Schedules 14 through 19); American Federation of Teachers, 2015 LM-2 (reporting $48,480,384 in Schedules 11 and 12 with $21,129,025 spent on “representational activities” according to Detailed Summary Page – Schedules 14 through 19); American Federation of Teachers, 2014 LM-2 (reporting $46,340,526 in Schedules 11 and 12 with $21,310,603 spent on “representational activities” according to Detailed Summary Page – Schedules 14 through 19); American Federation of Teachers, 2013 LM-2 (reporting $43,582,916 in Schedules 11 and 12 with $19,521,194 spent on “representational activities” according to Detailed Summary Page – Schedules 14 through 19).
- See Appendix; American Federation of Teachers, 2018 LM-2 (reporting $20,249,923 in benefits); American Federation of Teachers, 2017 LM-2 (reporting $17,440,244 in benefits); American Federation of Teachers, 2016 LM-2 (reporting $17,444,949 in benefits); American Federation of Teachers, 2015 LM-2 (reporting $17,324,521 in benefits); American Federation of Teachers, 2014 LM-2 (reporting $15,992,895 in benefits); American Federation of Teachers, 2013 LM-2 (reporting $15,695,947 in benefits).
- Illinois State Board of Education, “Illinois Report Card 2017-2018,” State Snapshot.
- American Federation of Teachers, 2018 LM-2 (Schedules 11 and 12).
- American Federation of Teachers, 2013-2018 LM-2s.
- National Education Association, 2013-2018 LM-2s.
- See Appendix; American Federation of Teachers, 2018 LM-2 (reporting $31,180,053 on “political activities and lobbying”); American Federation of Teachers, 2017 LM-2 (reporting $40,022,776 on “political activities and lobbying”); American Federation of Teachers, 2016 LM-2 (reporting $28,593,202 on “political activities and lobbying”); American Federation of Teachers, 2015 LM-2 (reporting $37,574,845 on “political activities and lobbying”); American Federation of Teachers, 2014 LM-2 (reporting $24,873,345 on “political activities and lobbying”); American Federation of Teachers, 2013 LM-2 (reporting $28,308,439 on “political activities and lobbying”).
- See Appendix; American Federation of Teachers, 2018 LM-2 (reporting $9,885,126 on “contributions, gifts, and grants”); American Federation of Teachers, 2017 LM-2 (reporting $4,047,946 on “contributions, gifts, and grants”); American Federation of Teachers, 2016 LM-2 (reporting $5,076,607 on “contributions, gifts, and grants”); American Federation of Teachers, 2015 LM-2 (reporting $4,398,721 on “contributions, gifts, and grants”); American Federation of Teachers, 2014 LM-2 (reporting $4,277,622 on “contributions, gifts, and grants”); American Federation of Teachers, 2013 LM-2 (reporting $3,436,749 on “contributions, gifts, and grants”).
- See Appendix; Illinois Federation of Teachers, 2018 LM-2 (reporting $46,804,658 in total spending); Illinois Federation of Teachers, 2017 LM-2 (reporting $44,808,470 in total spending); Illinois Federation of Teachers, 2016 LM-2 (reporting $43,658,710 in total spending); Illinois Federation of Teachers, 2015 LM-2 (reporting $43,789,753 in total spending); Illinois Federation of Teachers, 2014 LM-2 (reporting $ 41,552,961 in total spending); Illinois Federation of Teachers, 2013 LM-2 (reporting $41,567,861 in total spending).
- See Appendix; Illinois Federation of Teachers, 2018 LM-2 (reporting $11,767,936 for representational activities); Illinois Federation of Teachers, 2017 LM-2 (reporting $11,767,928 for representational activities); Illinois Federation of Teachers, 2016 LM-2 (reporting $10,925,298 for representational activities); Illinois Federation of Teachers, 2015 LM-2 (reporting $11,427,695 for representational activities); Illinois Federation of Teachers, 2014 LM-2 (reporting $10,180,466 for representational activities); Illinois Federation of Teachers, 2013 LM-2 (reporting $10,651,705 for representational activities).
- These activities are defined by the U.S. Department of Labor as “the labor organization’s direct and indirect disbursements to all entities and individuals during the reporting period associated with preparation for, and participation in, the negotiation of collective bargaining agreements and the administration and enforcement of the agreements made by the labor organization.” United States Department of Labor, “Instructions for form LM-2 labor organization annual report,” November 2010. It also includes activities related to organizing a unit or warding off a decertification.
- BBB Wise Giving Alliance, “Governance and oversight.”
- Unions are required to report the percentage of each employee’s salary that represents the portion of their work devoted to “representational activities.” That means we can calculate how much of an officer’s or employee’s pay was not for tasks related to representational activities. See Illinois Federation of Teachers, 2018 LM-2 (reporting $10,920,984 in Schedules 11 and 12 with $6,016,222 spent on “representational activities” according to Detailed Summary Page – Schedules 14 through 19); Illinois Federation of Teachers, 2017 LM-2 (reporting $10,927,756 in Schedules 11 and 12 with $5,860,908 spent on “representational activities” according to Detailed Summary Page – Schedules 14 through 19); Illinois Federation of Teachers, 2016 LM-2 (reporting $10,810,013 in Schedules 11 and 12 with $ 5,492,134 spent on “representational activities” according to Detailed Summary Page – Schedules 14 through 19); Illinois Federation of Teachers, 2015 LM-2 (reporting $10,852,440 in Schedules 11 and 12 with $5,412,020 spent on “representational activities” according to Detailed Summary Page – Schedules 14 through 19); Illinois Federation of Teachers, 2014 LM-2 (reporting $10,423,839 in Schedules 11 and 12 with $4,718,755 spent on “representational activities” according to Detailed Summary Page – Schedules 14 through 19); Illinois Federation of Teachers, 2013 LM-2 (reporting $10,112,682 in Schedules 11 and 12 with $4,732,190 spent on “representational activities” according to Detailed Summary Page – Schedules 14 through 19).
- See Appendix; Illinois Federation of Teachers, 2018 LM-2 (reporting $4,285,293 in benefits); Illinois Federation of Teachers, 2017 LM-2 (reporting $4,208,635 in benefits); Illinois Federation of Teachers, 2016 LM-2 (reporting $4,191,004 in benefits); Illinois Federation of Teachers, 2015 LM-2 (reporting $4,049,184 in benefits); Illinois Federation of Teachers, 2014 LM-2 (reporting $3,802,787 in benefits); Illinois Federation of Teachers, 2013 LM-2 (reporting $3,856,164 in benefits).
- Illinois Federation of Teachers, 2013-2018 LM-2s.
- Illinois State Board of Education, “Illinois Report Card 2017-2018,” State Snapshot.
- Illinois Federation of Teachers, 2018 LM-2 (Schedules 11 and 12).
- Illinois Federation of Teachers, 2013-2018 LM-2s.
- Illinois Federation of Teachers, 2013-2018 LM-2s.
- Illinois Federation of Teachers, 2013-2018 LM-2s.
- See Appendix; Illinois Federation of Teachers, 2018 LM-2 (reporting $846,426 on “political activities and lobbying”); Illinois Federation of Teachers, 2017 LM-2 (reporting $844,777 on “political activities and lobbying”); Illinois Federation of Teachers, 2016 LM-2 (reporting $836,430 on “political activities and lobbying”); Illinois Federation of Teachers, 2015 LM-2 (reporting $943,225 on “political activities and lobbying”); Illinois Federation of Teachers, 2014 LM-2 (reporting $1,296,587 on “political activities and lobbying”); Illinois Federation of Teachers, 2013 LM-2 (reporting $1,070,229 on “political activities and lobbying”).
- See Appendix; Illinois Federation of Teachers, 2018 LM-2 (reporting $6,650 in “contributions, gifts, and grants”); Illinois Federation of Teachers, 2017 LM-2 (reporting $15,900 in “contributions, gifts, and grants”); Illinois Federation of Teachers, 2016 LM-2 (reporting $31,035 in “contributions, gifts, and grants”); Illinois Federation of Teachers, 2015 LM-2 (reporting $67,765 in “contributions, gifts, and grants”); Illinois Federation of Teachers, 2014 LM-2 (reporting $47,927 in “contributions, gifts, and grants”); Illinois Federation of Teachers, 2013 LM-2 (reporting $27,380 in “contributions, gifts, and grants”).