
Illinois is losing taxpayers from every income bracket and age group
Newly released IRS migration data reveal that high-income earners and prime working-age residents left Illinois in record numbers in 2011 and 2012.
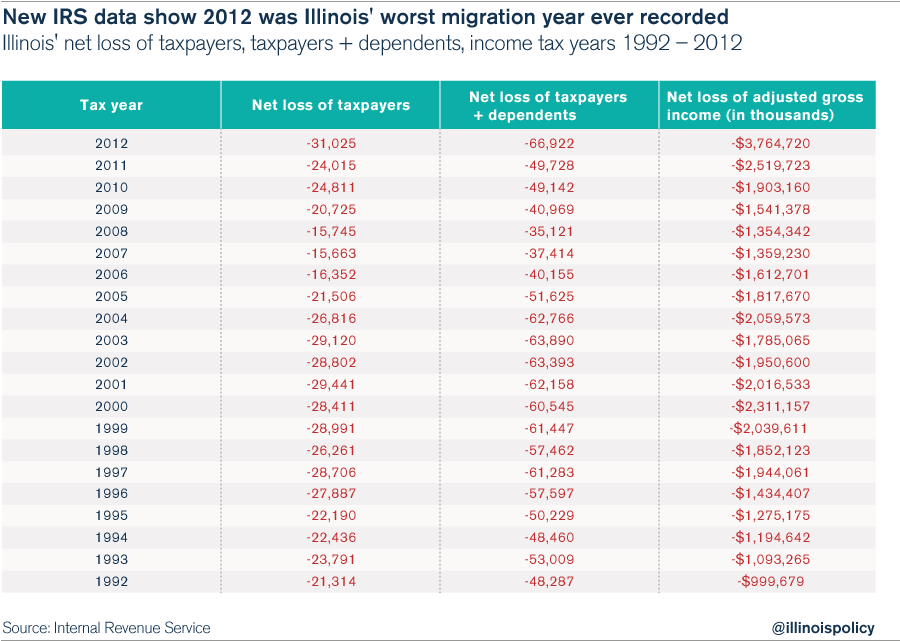
Illinois was a net loser of taxpayers and income across every age group and every income bracket for the 2011 and 2012 tax years, according to recently released Internal Revenue Service data.
The IRS’ migration data show that Illinois experienced especially heavy losses of people and income in the first two years of Illinois’ income-tax hike, primarily due to high-income earners and prime working-age residents fleeing the state. Illinois experienced a record net loss of taxpaying households, taxpayers plus dependents, and adjusted gross income in 2012. In fact, the 2012 net loss of $3.8 billion of annual income is unlike anything Illinois has ever seen before.
The new 2012 data reveal that Illinois experienced a net loss of taxpayers, dependents, and adjusted gross income, or AGI, across all income brackets. Illinois sustained an especially heavy net loss of income from taxpayers reporting more than $200,000 in annual AGI ($2.2 billion). The largest net loss of taxpaying households came from the state’s largest income bracket: households reporting $10,000 to $25,000 in adjusted gross income (7,295 taxpayers). The next highest losses came from households in the bracket reporting $25,000 to $50,000 in annual income (6,079 taxpayers).

A similar breakdown appears when looking at different age brackets. On net, Illinois lost taxpayers in every age bracket, with the biggest income loss coming from taxpayers ages 55 to 64 ($1.1 billion), and the biggest loss of taxpaying households coming from the prime working-age brackets of 26 to 34 (8,410 taxpayers) and 35 to 44 (6,685 taxpayers). It is especially bad news that these prime working-age adults, who are establishing themselves in their communities and raising families, are leaving Illinois.
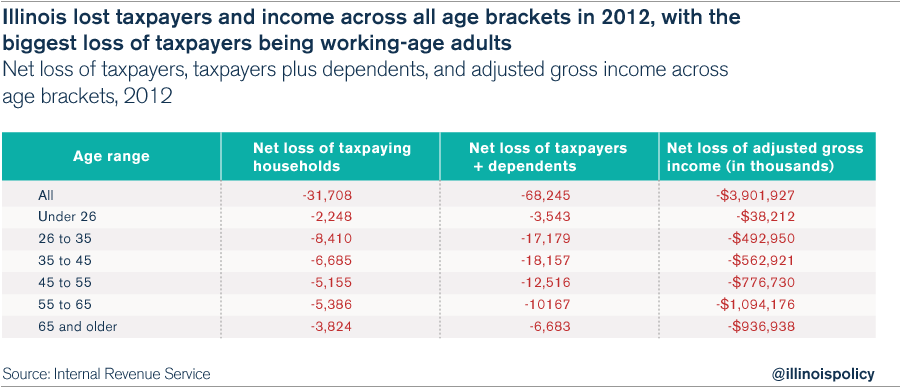
NOTE: The two charts above show the 2012 net losses for Illinois. The numbers are slightly different from those on the first chart of this blog because the 2011 and 2012 IRS data include the movement of American taxpayers into and out of the country, based on factors such as military deployments, which is not reflected in the original Illinois Policy Institute analysis in the first chart. The effect on the overall analysis is negligible.
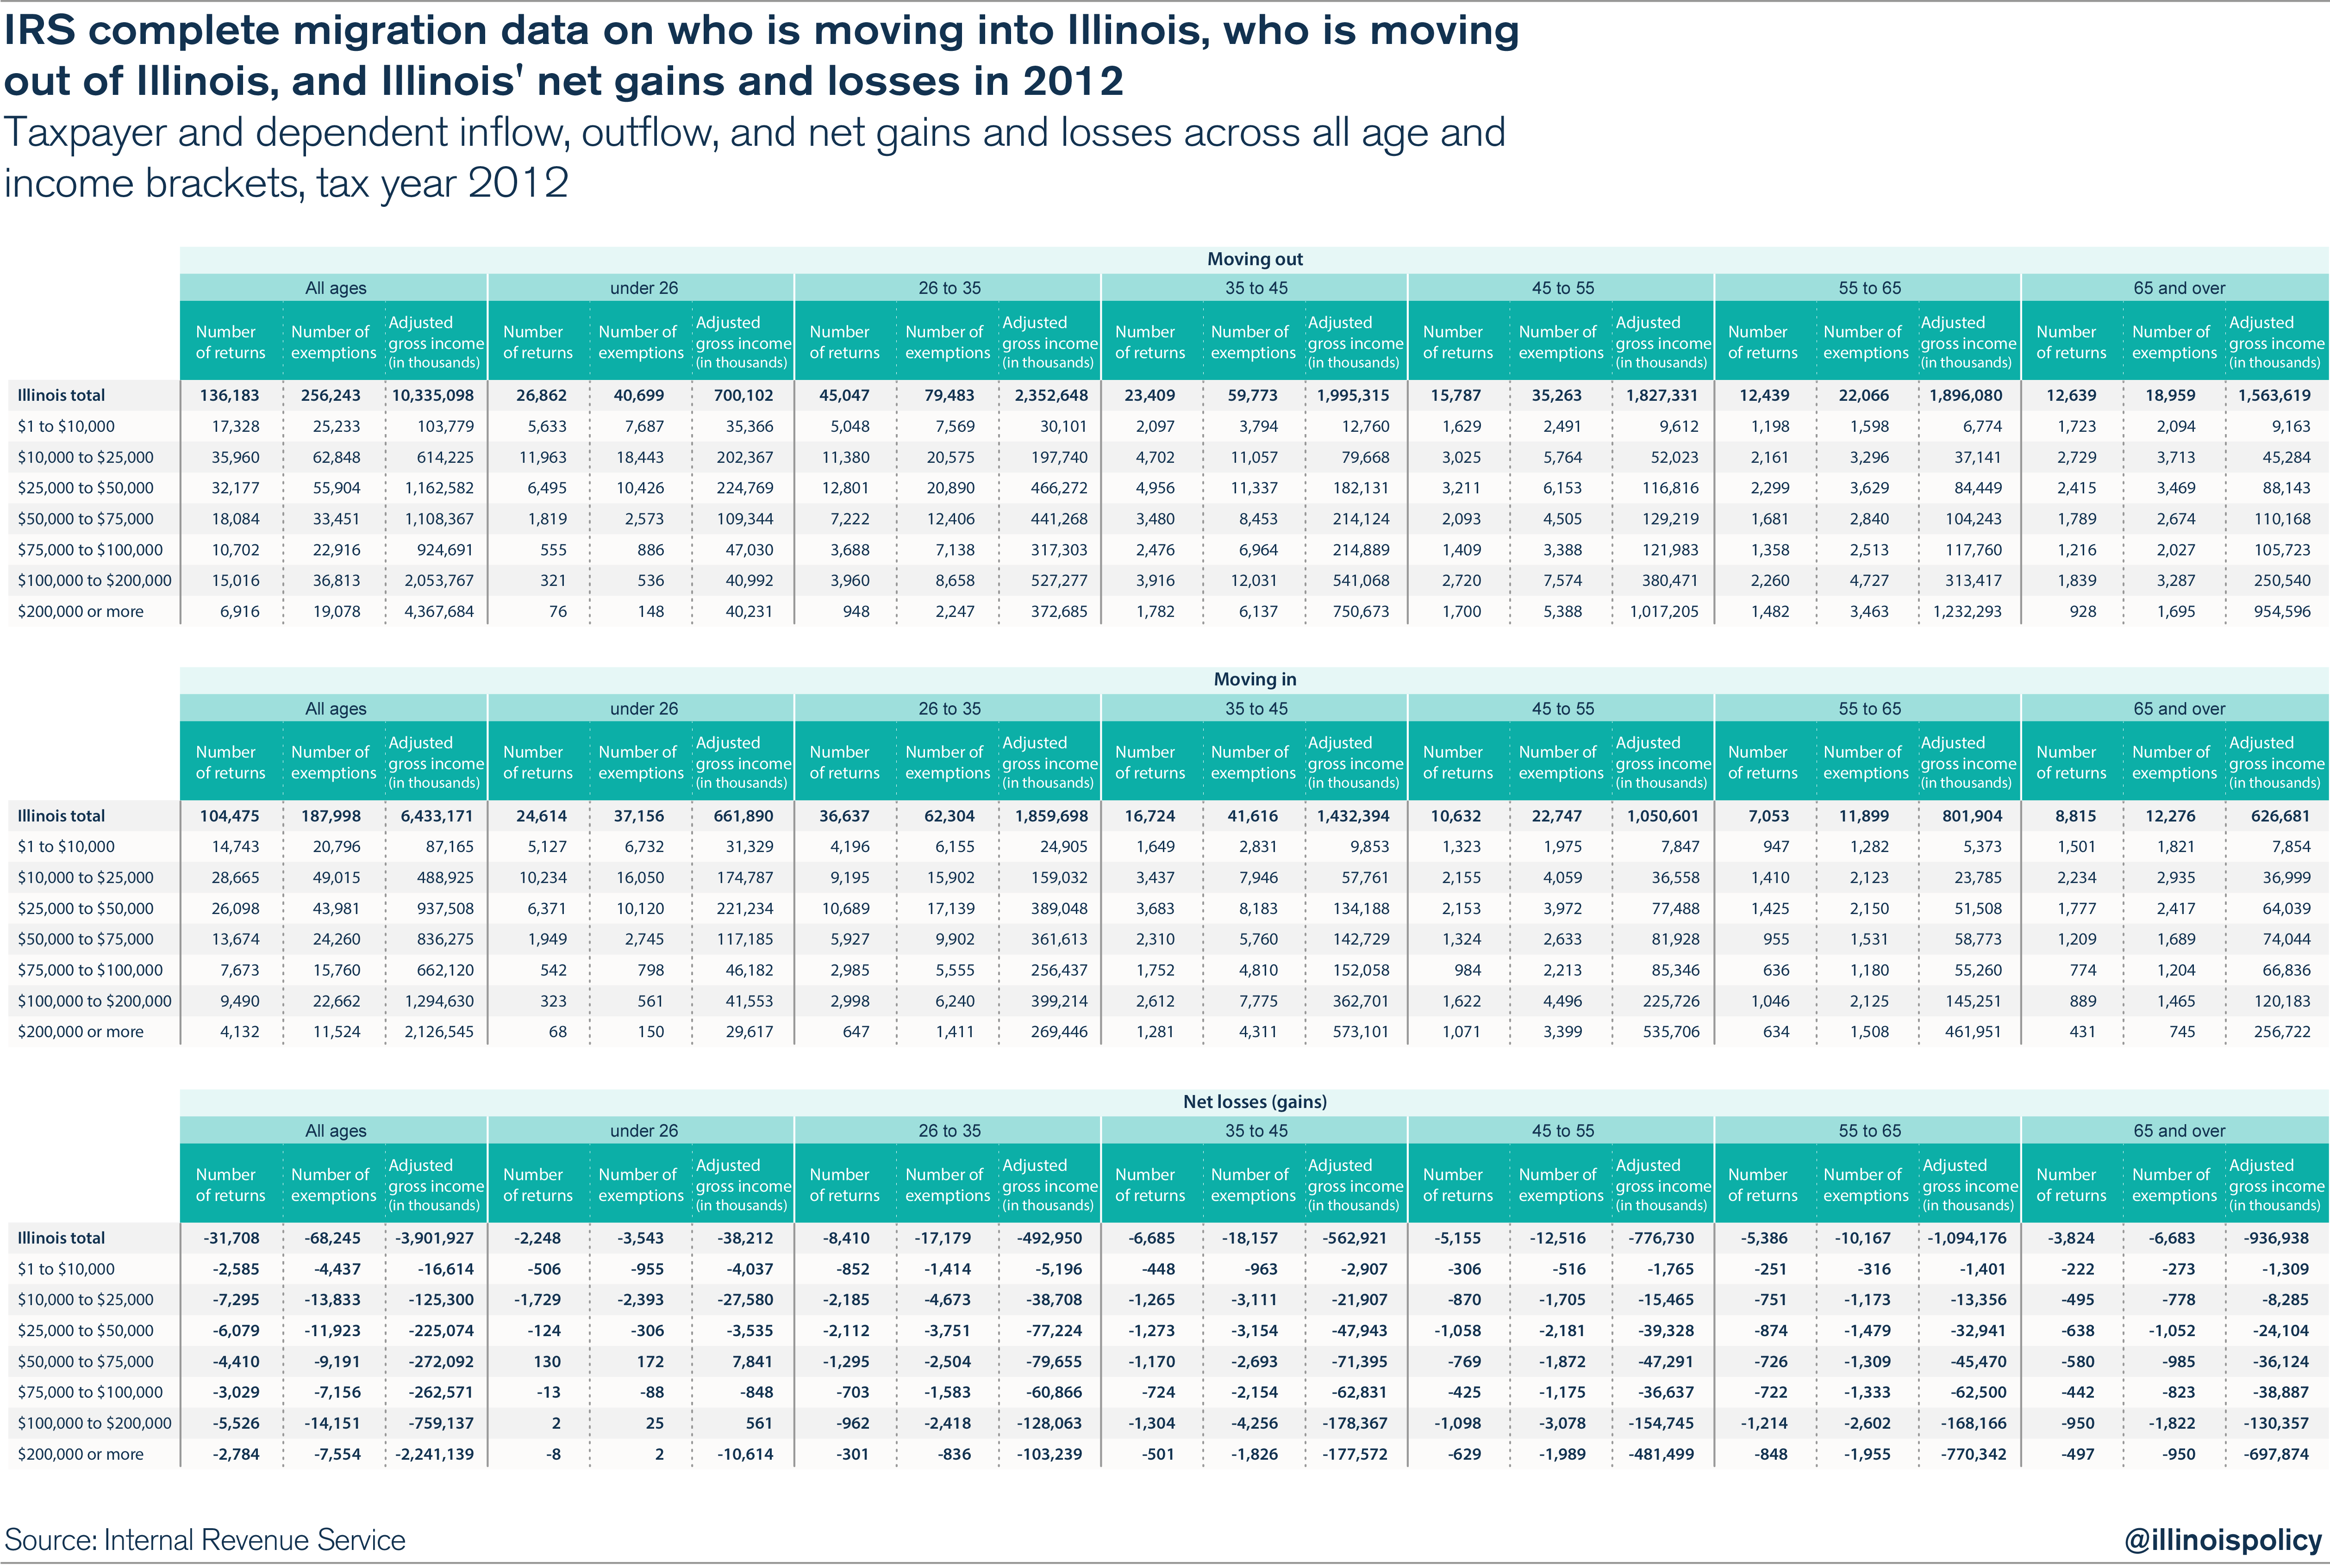
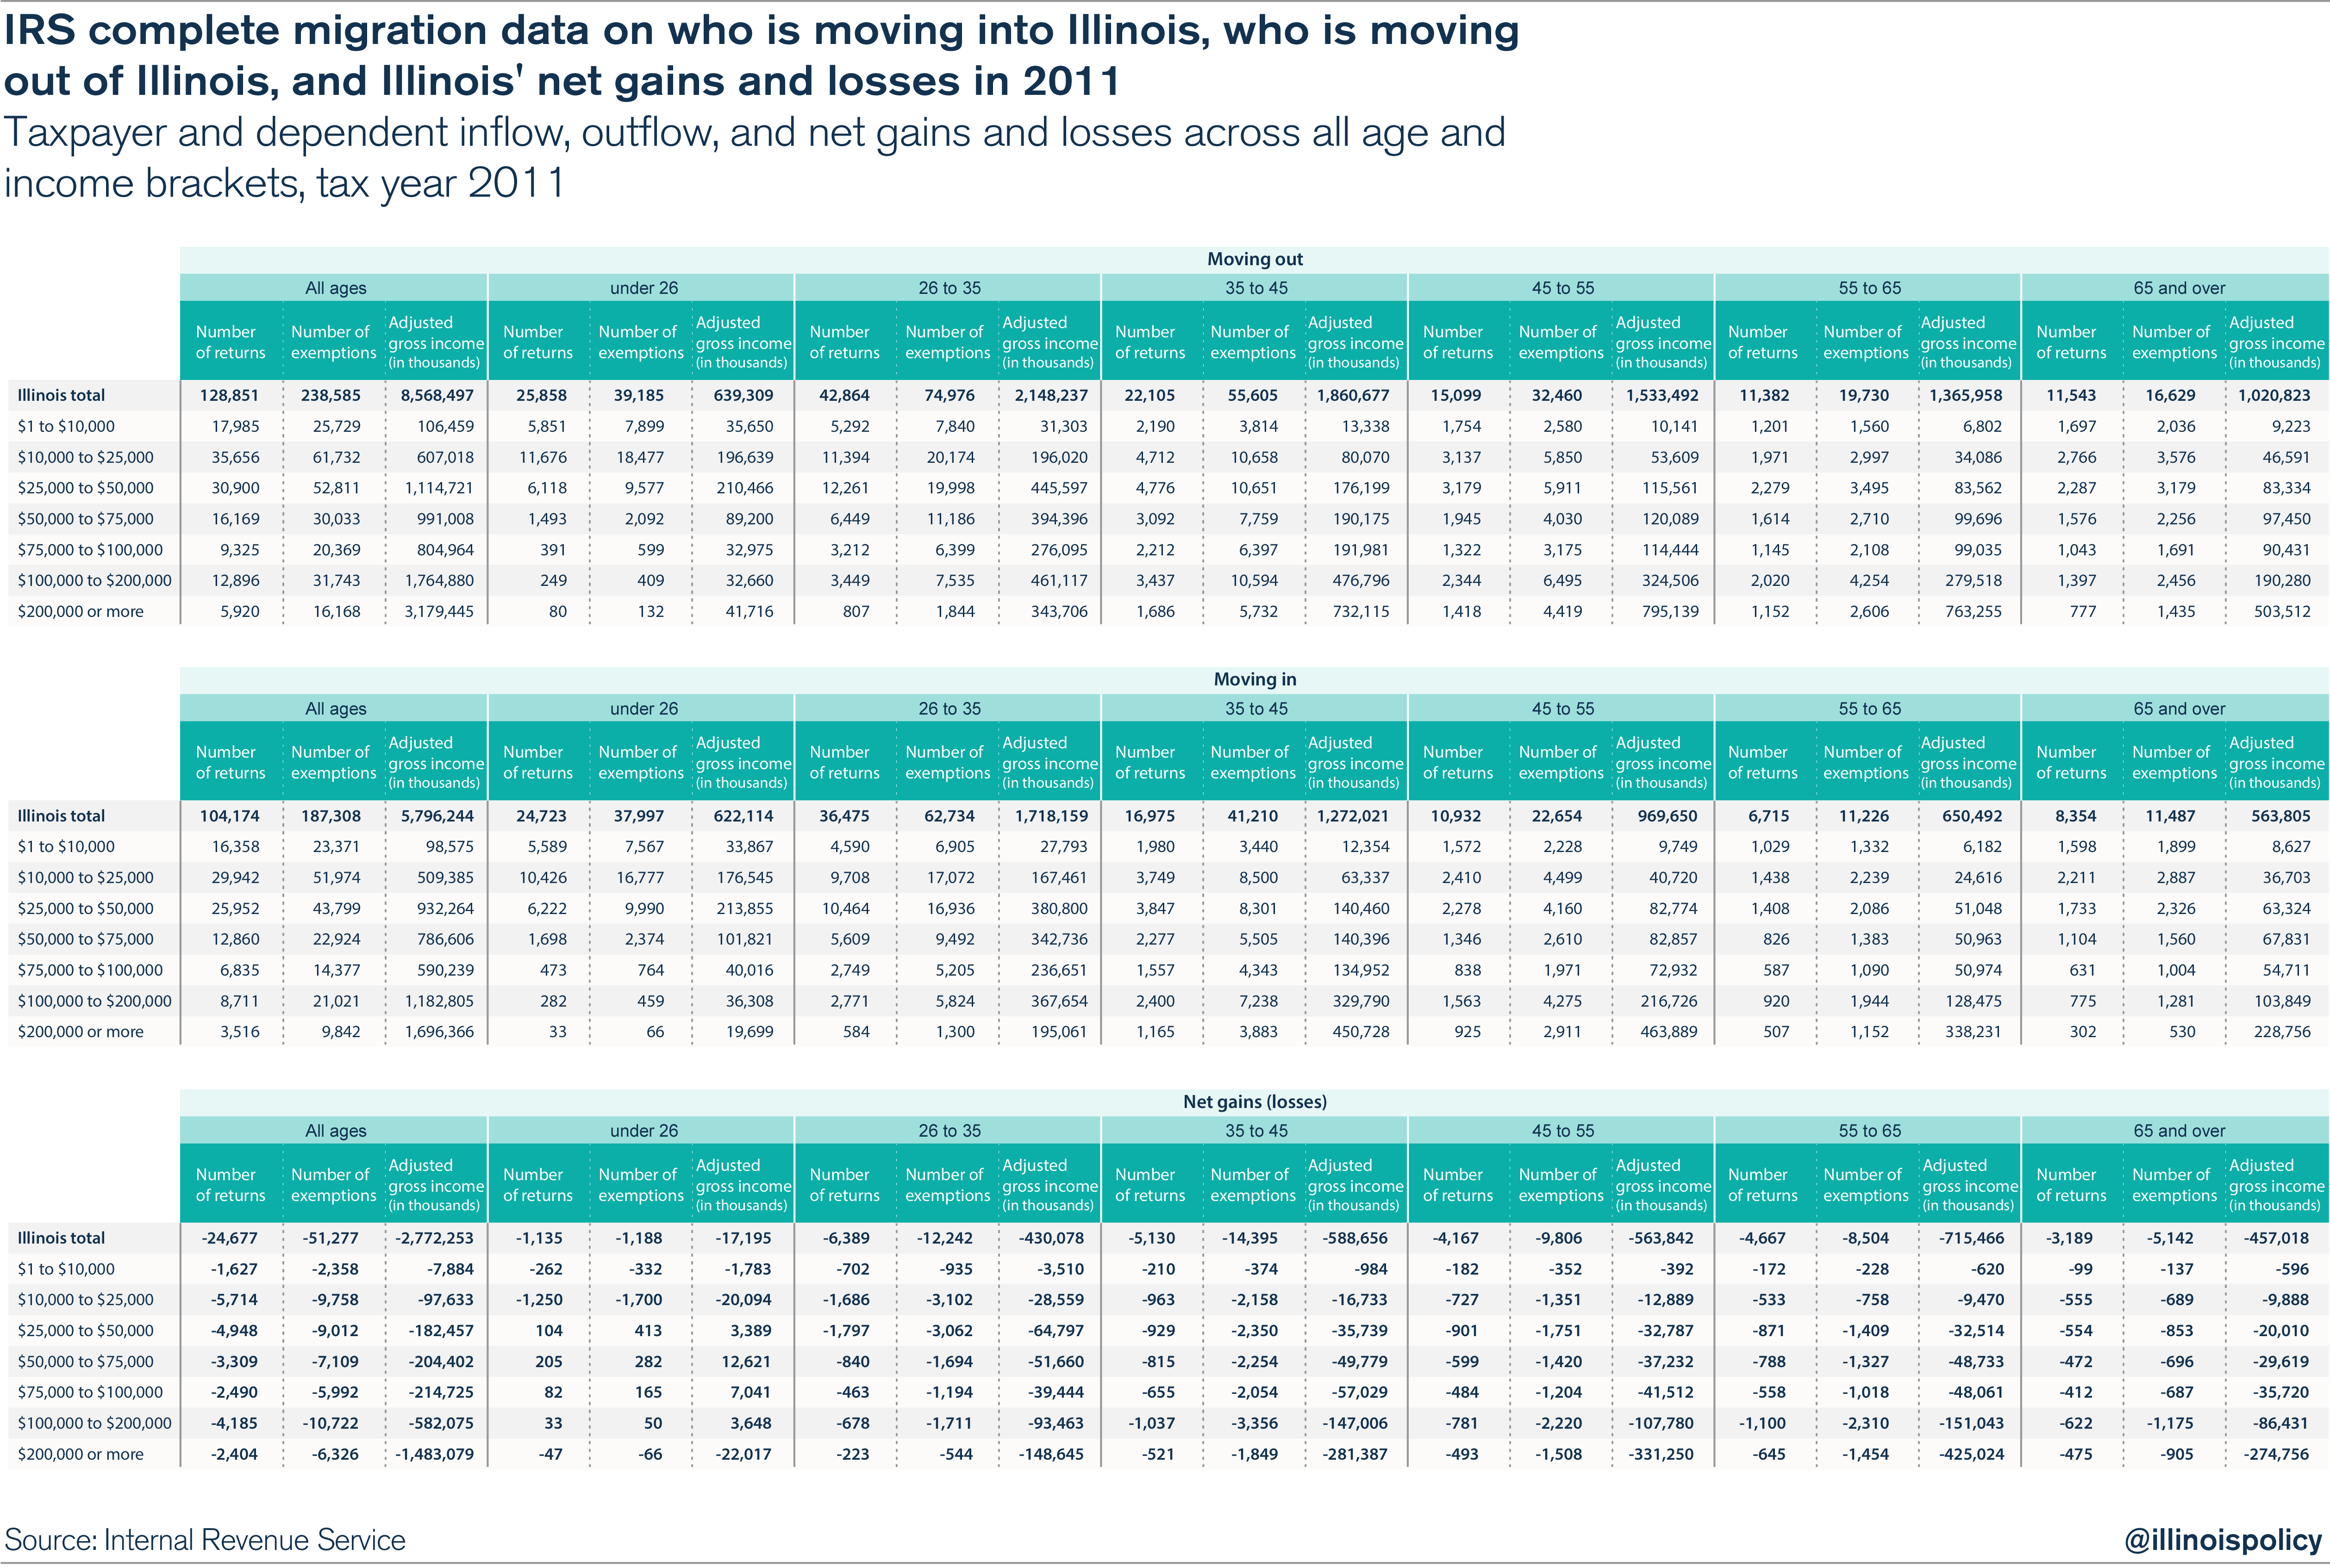
To see all of the migration details concerning Illinois taxpayers, including inflow, outflow and net losses by income level and age, click here.
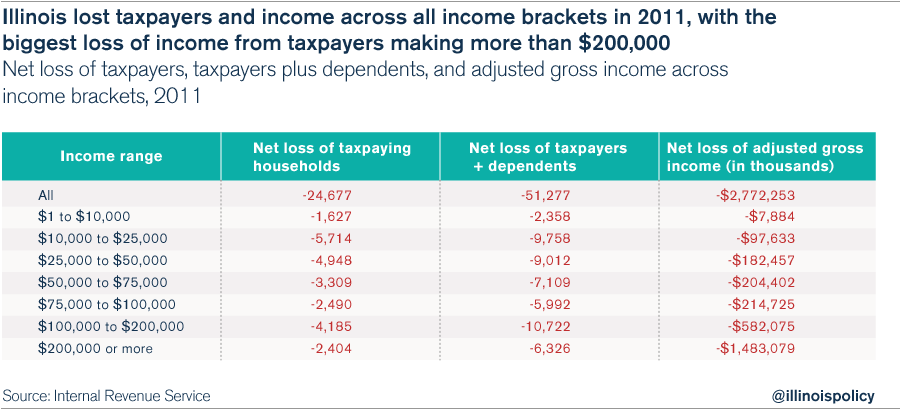
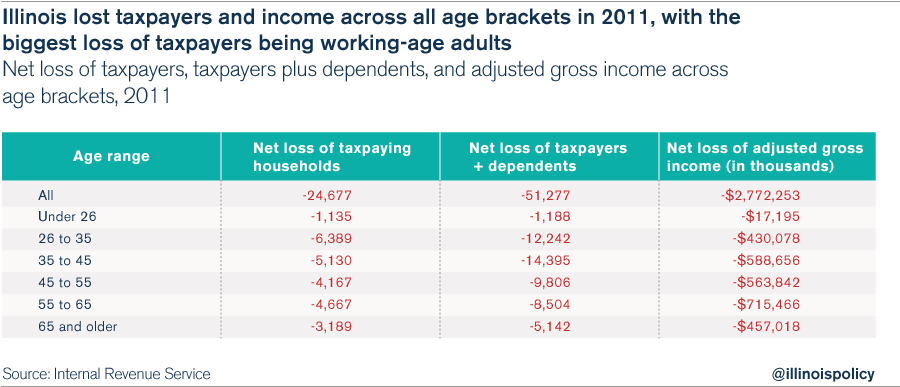
The 2011 data show a similar breakdown on a slightly smaller scale, reflecting the fact that Illinois’ out-migration was significantly worse in 2012 than in 2011. Once again, the largest amount of income lost was due to the net out-migration of taxpayers reporting more than $200,000 in annual income (-$1.5 billion). And with respect to taxpayers themselves, Illinois lost the most taxpayers from households reporting $10,000 to $25,000 in annual income (5,714 taxpayers), followed by taxpayers coming from households in the tax bracket reporting $25,000 to $50,000 in annual income (4,948 taxpayers).
As in 2012, Illinois lost taxpayers in every age bracket in 2011, with the biggest income loss coming from taxpayers ages 55 to 64 ($715 million), and the biggest loss of taxpaying households coming out of the prime working-age brackets of 26 to 34 (6,389) and 35 to 44 (5,130).
NOTE: The two charts above show the 2011 net losses for Illinois. The numbers are slightly different from the first chart in this blog because of the inclusion of the movement of Americans into and out of the country, based on factors such as military deployments, which is not reflected in the original Illinois Policy Institute analysis of the first chart. The effect on the overall analysis is negligible.
To see all of the migration details concerning Illinois taxpayers, including inflow, outflow and net losses by income level and age, click here.
This new information from the IRS reveals the characteristics of people who are leaving Illinois. The losses span all income brackets and all age groups, with the greatest loss of people coming from the prime working-age brackets (26 to 44), and the heaviest loss of income coming from taxpayers reporting more than $200,000 per year in income.
These data are especially relevant when considering the effects of the 2011 income-tax hikes, and speak to the danger of further income-tax increases. Unsurprisingly, people who make a lot of money chose to leave the state. The prospect of a progressive income-tax system or a millionaire’s tax would certainly make this worse.
The loss of taxpaying households in the prime working-age brackets and the fact that the lower- and middle-income brackets have the most people leaving the state demonstrate that Illinois is not creating enough good job opportunities. To staunch the outflow of taxpayers and income, Illinois must change its anti-growth tax and regulatory climate.