
Illinois labor-union membership in 10 charts
One in 10 workers in the private, for-profit sector are union members in Illinois – 1 in 12 in the nonprofit sector. But more than half of Illinois’ government workers belong to a union.
Gov. Bruce Rauner has proposed dramatic reforms that could affect both public and private union participation in Illinois, and two particular labor union issues are now in the headlines.
The first issue is whether Illinois state workers should be forced to pay money to a labor union as a condition of their employment. The second issue centers on local employment opportunity zones, which would allow municipal governments to decide whether workers should be forced to pay dues to both public and private unions.
Even though roughly 15 percent of wage and salary workers in Illinois are members of a union, the limited government data that is publicly available does not delve into the demographics and incomes of these workers on the state level.
In order to provide a broad and general snapshot of labor-union membership in Illinois, the Illinois Policy Institute commissioned a custom data search from Bloomberg BNA to shed light on the labor community. This study provides a glimpse into union membership in Illinois.
Researchers for Bloomberg BNA analyzed data from the U.S. Census Bureau’s Current Population Survey. The results are based on the annual surveys from 2012 to 2014, resulting in three-year averages. The survey includes workers aged 16 and over, and all earnings data are in 2014 dollars.
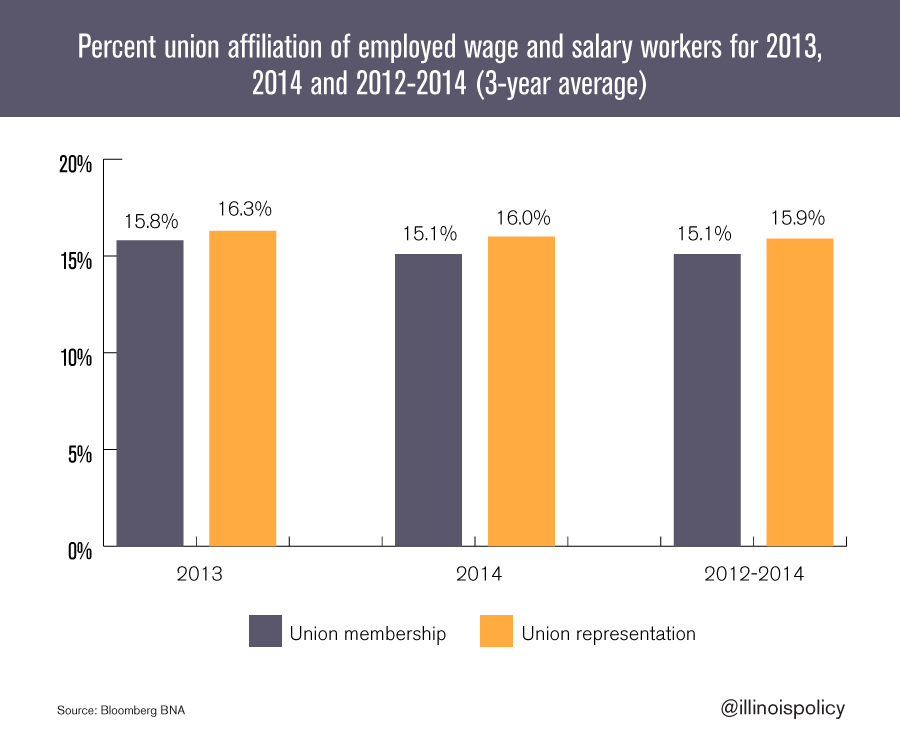
Today, 15 percent of Illinois’ wage and salary workers are union members. Sixteen percent of Illinois’ wage and salary workers are covered by a collective-bargaining agreement.
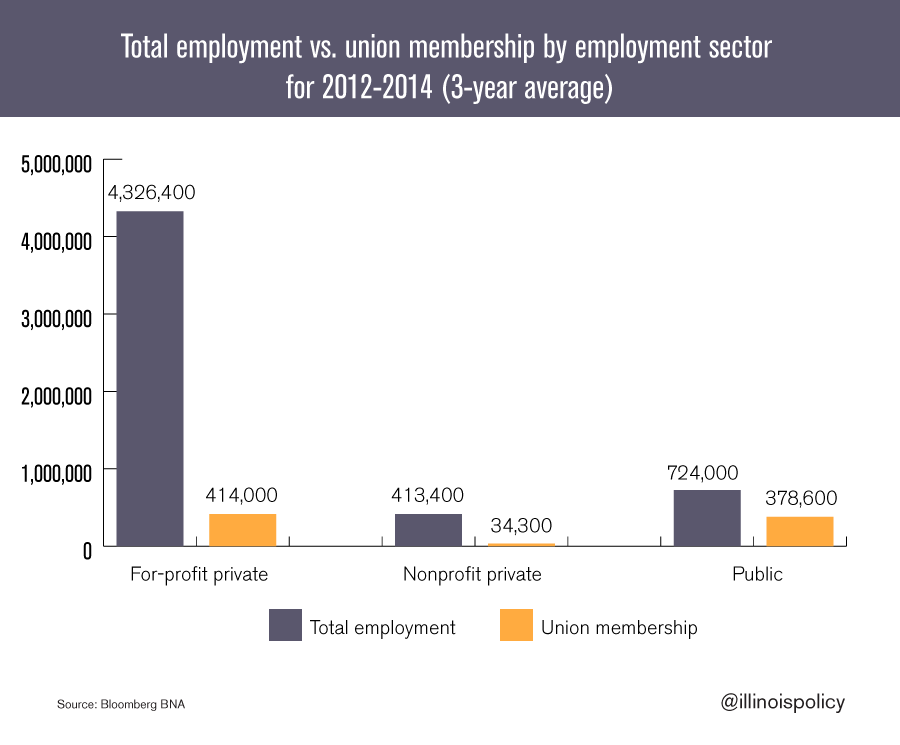
In Illinois, union members work in three types of employment arrangements: for-profit private, nonprofit private and public. The largest of these groups, “for-profit private,” employs about 4.3 million workers across the state. Of this group, about 414,000 workers are union members. In other words, about 1 in 10 workers who work in private-sector, for-profit environments are union members.
The smallest group, “nonprofit private,” employs 413,400 workers in Illinois. More than 34,000 of these workers are union members. That is about 1 of every 12 “nonprofit private” workers who are union members.
There are 724,000 public employees in Illinois. Of those employees, 378,600, or just over half, are union members.
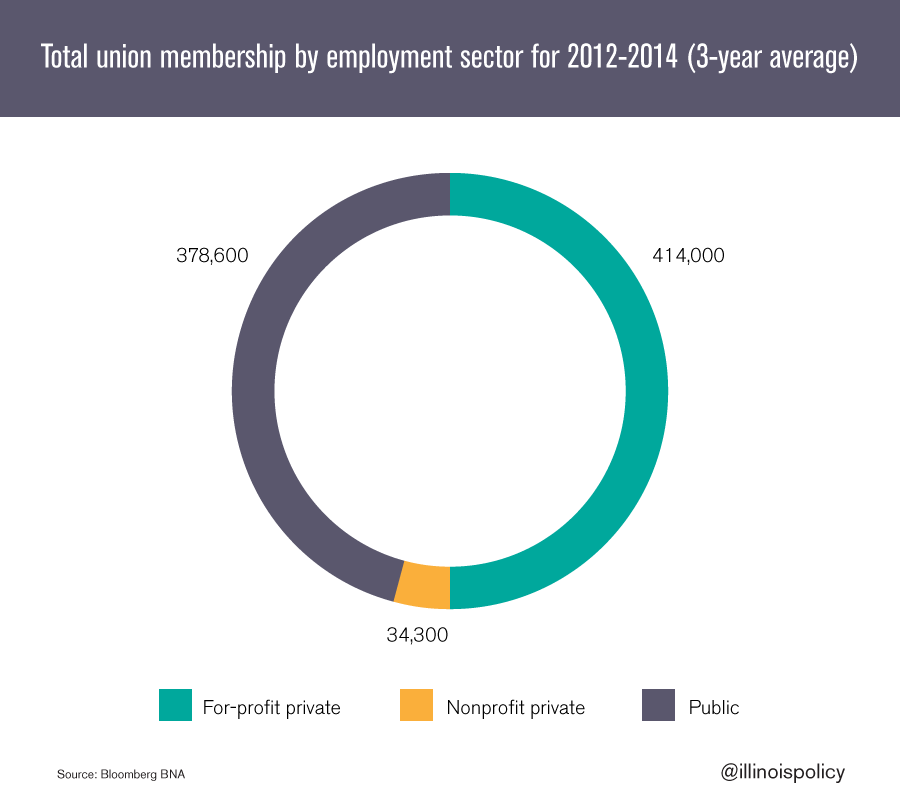
There are nearly 827,000 union members in Illinois. The members working in “for-profit private” organizations make up about half of the total union membership in Illinois.
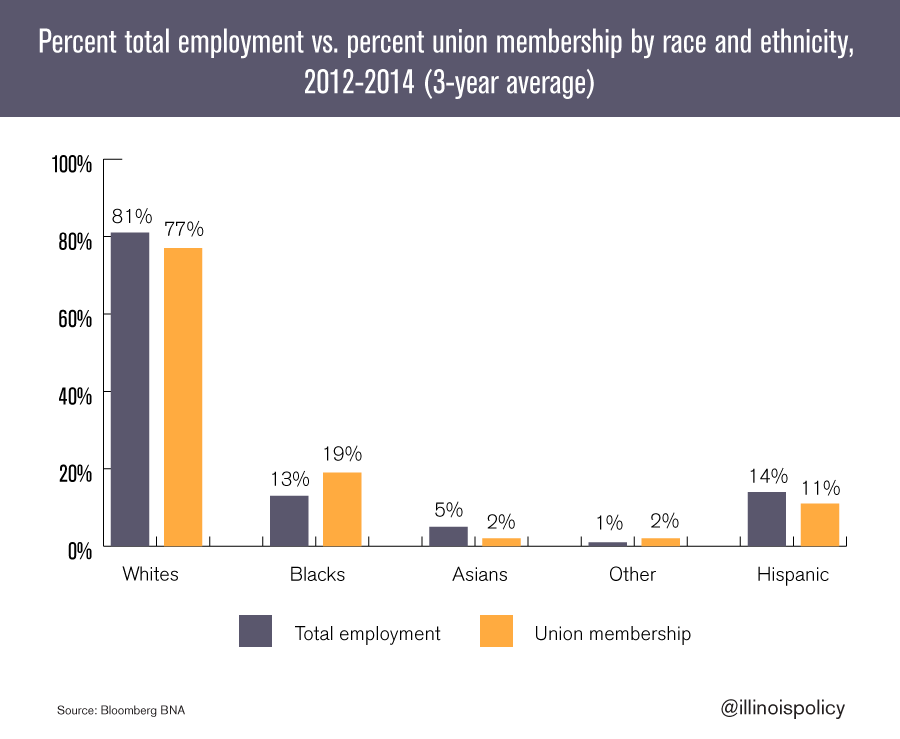
Based on the state’s total employment by race and Hispanic ethnicity, the data revealed that whites are underrepresented in total combined public and private union membership. They make up 81 percent of workers in Illinois, but 77 percent of union members.
Blacks are overrepresented. Blacks make up 13 percent of workers in Illinois, but account for 19 percent of union members.
Asians make up 5 percent of Illinois workers, but only 2 percent of union members.
Hispanics account for 14 percent of Illinois workers but are underrepresented as they account for 11 percent of union members. It should be noted that since Hispanics can be of any race, they are also included in each of the race categories.
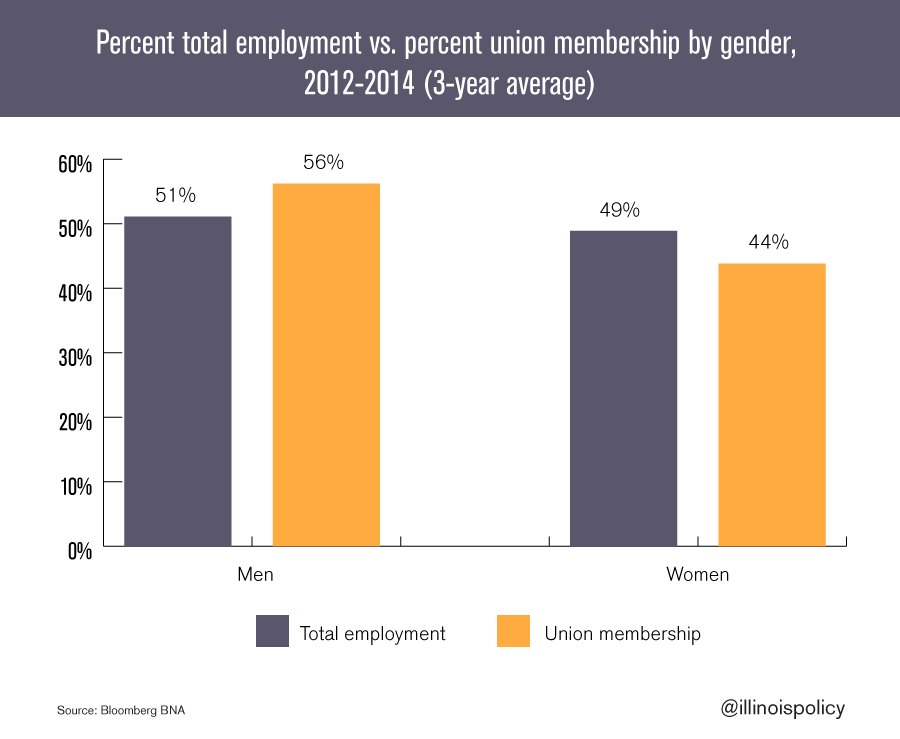
Illinois workers are almost evenly split between men and women, with men making up 51 percent and women making up 49 percent of all workers. But men account for 56 percent and women account for 44 percent of the union workforce.
In other words, there are approximately 41,000 fewer female union members in Illinois than if union membership reflected the Illinois workforce.
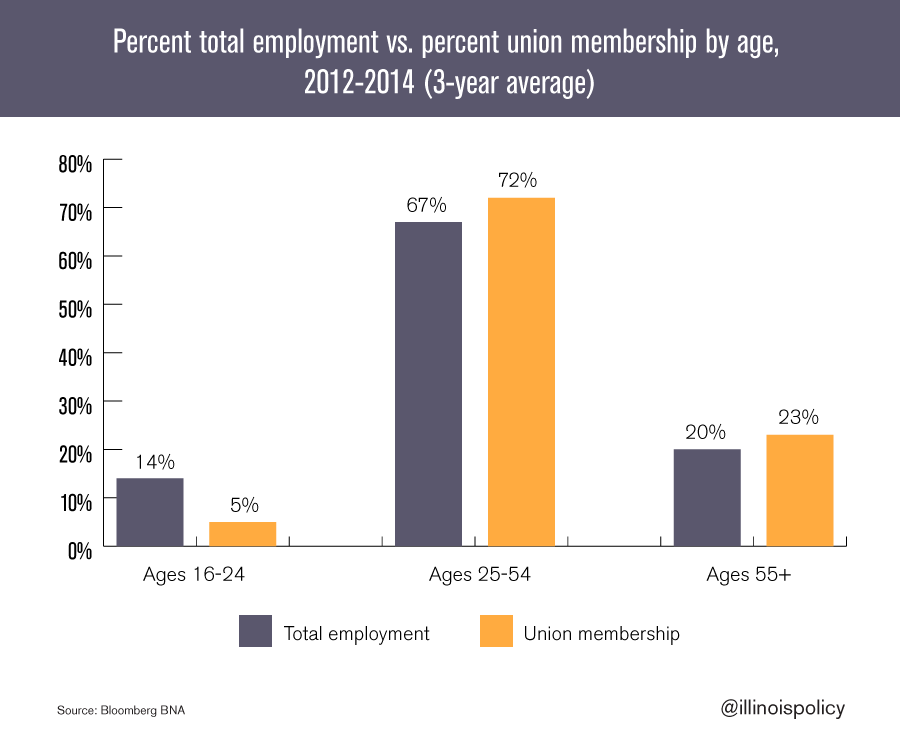
Union membership is less common among workers aged 16-24. More than two-thirds of Illinois workers are between ages 25-64, and that age group makes up 72 percent of total union membership. Workers aged 55 and over make up 20 percent of Illinois workers and 23 percent of union members.
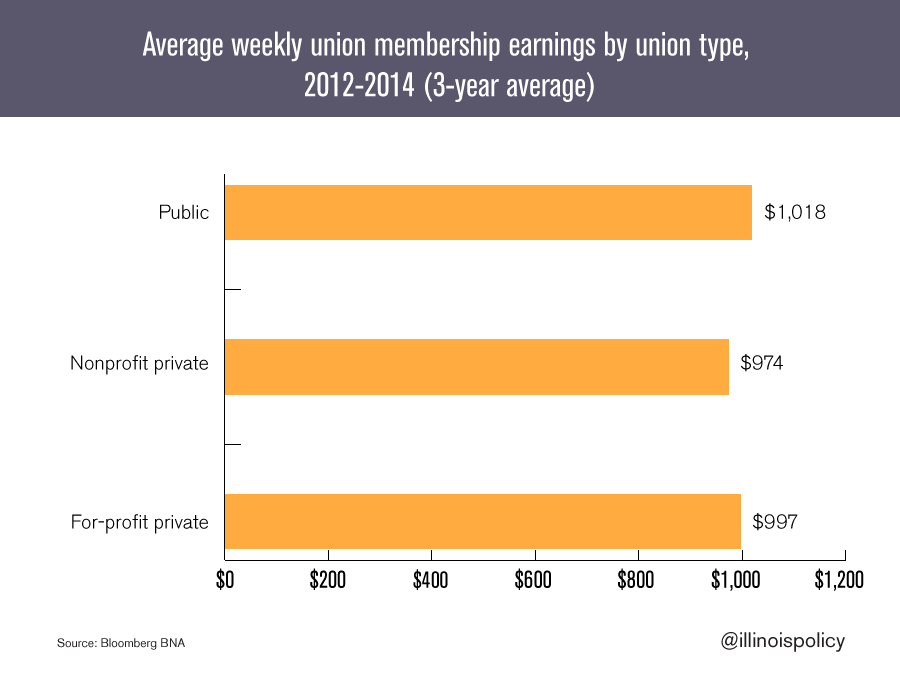
In Illinois, union members earn an average of between $974 per week for the “nonprofit private” union members to $1,018 per week for the public union members.
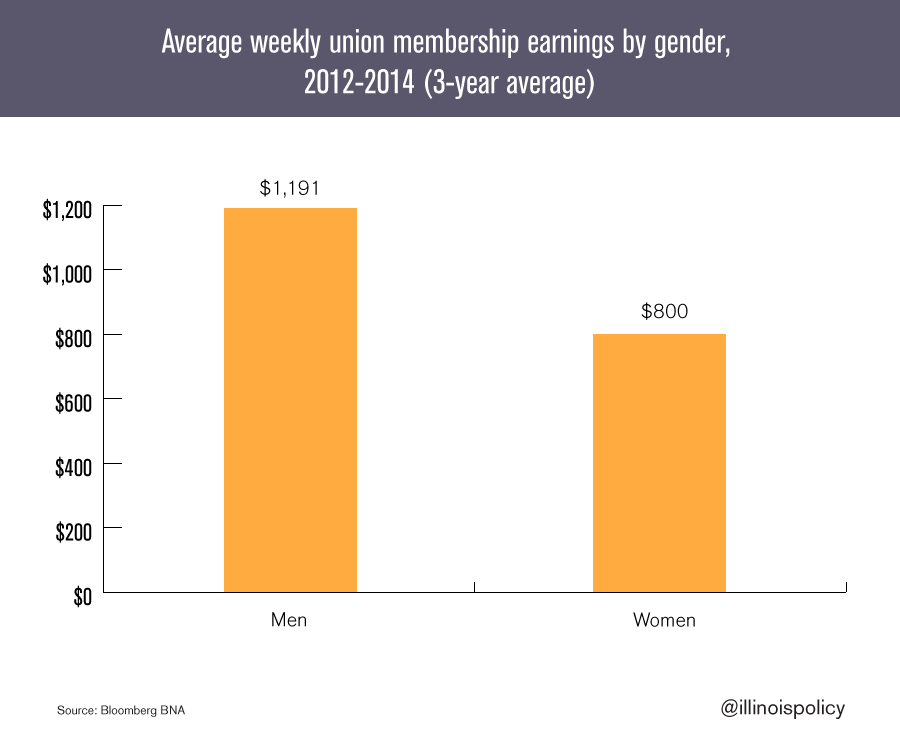
On average, female union members in Illinois earn about 67 cents for every dollar a male union member earns.
Male union members earn a weekly average income that is almost 50 percent higher than female union members in Illinois. Male union members average $1,191 per week while women average $800 per week.
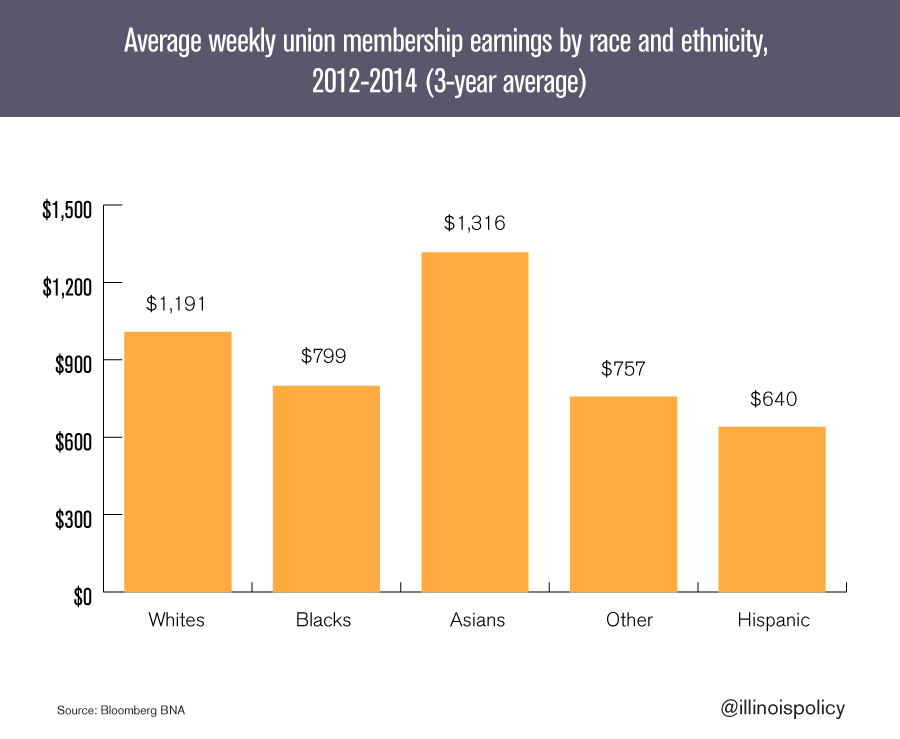
Another earnings disparity is found between racial and ethnic groups. Black union members earn an average of 25 percent less than their white union-member cohorts. Hispanic union members earn almost 40 percent less than whites.
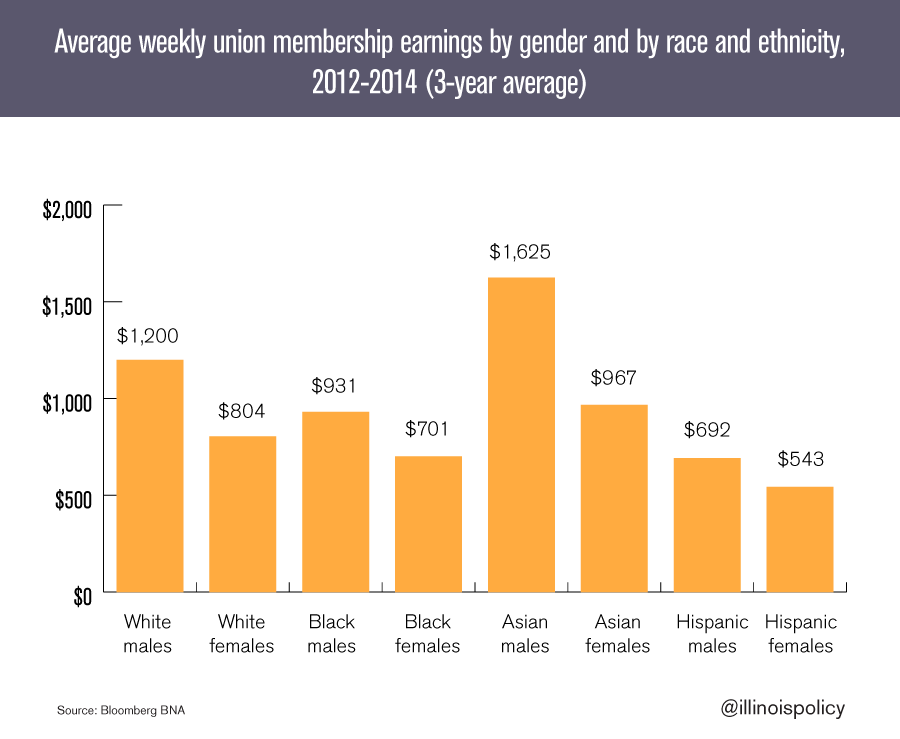
Asian males lead the average weekly union member earnings at $1,625 per week. White males are a distant second at $1,200.
Hispanic men and women, who can be of any race, are the two lowest union-member earnings groups. Hispanic men earn an average $692 per week and Hispanic women earn $543. The next-highest earning group is Black females who earn a weekly average of $701.
It should be noted that, for every racial and ethnic group, women union members earn less than men within their racial or ethnic cohort, on average.
Image credit: Armando G. Alonso