IRS migration data show wealth and youth are fleeing Illinois
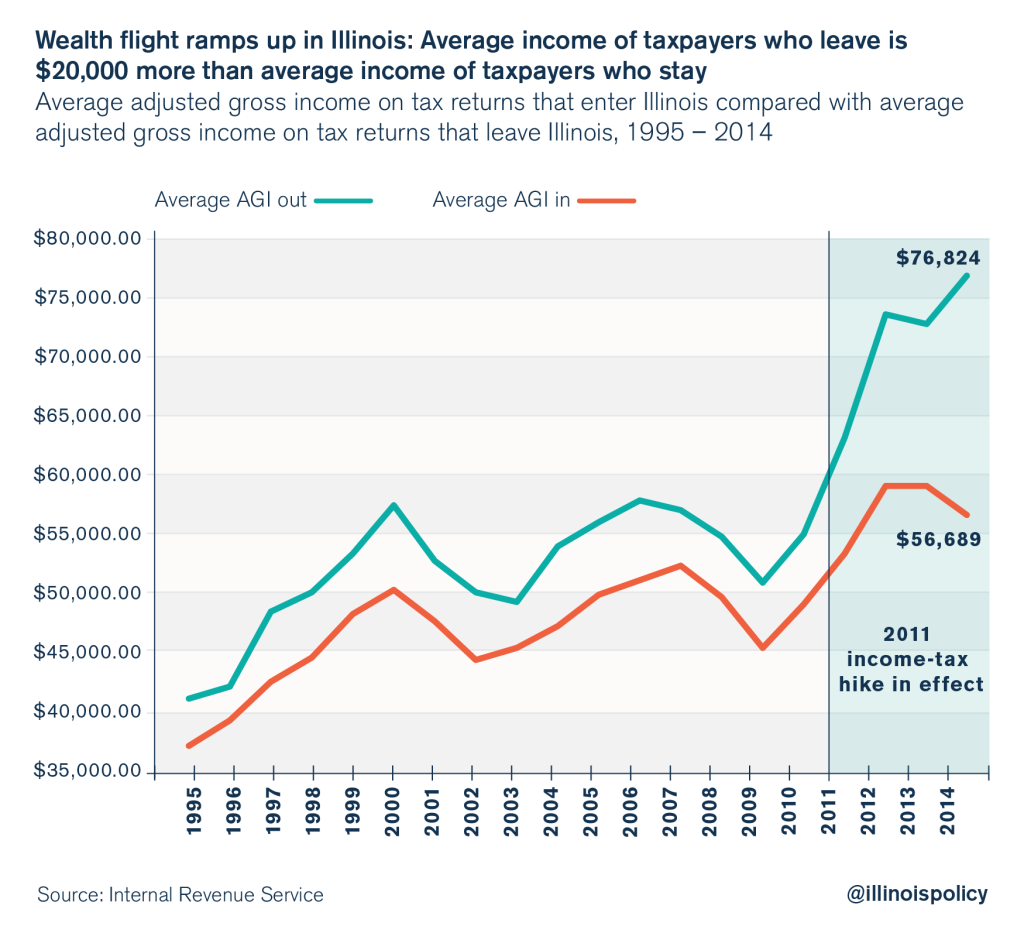
Illinois’ 2011 income-tax hike caused out-migration that cost the state high-earning taxpayers. New IRS data show taxpayers who left had an average income of $77,000 per year, compared with taxpayers who entered Illinois, who had an average income of $57,000 per year.
Not only did Illinois lose tens of thousands more taxpayers than it gained from migration in the 2014 tax year, but the average income of people leaving spiked to record levels, according to IRS data. Meanwhile the average income of people entering Illinois actually declined from tax years 2012 and 2013. The difference in earning power between taxpayers who left Illinois and taxpayers who entered Illinois hit an all-time high of $20,000 in 2014.
Income data show wealth flight followed Illinois’ 2011 tax hikes
The income levels of people entering and leaving Illinois changed significantly following the 2011 state income-tax hikes. For the 16 years of tax data from 1995-2010, people leaving Illinois earned more, but the difference between the average income of people entering the state and people leaving the state was $5,350 per year, with a range of $3,000-$7,000.
That trend has been very different over the last four years of data, which happen to be from 2011-2014, the four years during which the tax hike was in place. In short, during the tax-hike years, the average income of people leaving the state went up substantially while the average income of people entering the state barely went up at all.
In 2011, the difference in average income between people who left compared with people who entered Illinois bumped up to $10,000 per year; by 2012 the difference exceeded $14,000 per year; and in 2013 the difference was again nearly $14,000 per year. The new data from 2014 show that the difference in average income levels between in-migrants and out-migrants hit an unprecedented $20,000. Taxpayers who left had an average income of $77,000 per year, compared with taxpayers who entered Illinois, who had an average income of $57,000 per year.

These data reveal the wealth flight associated with the historic income-tax hikes of 2011. The people who left Illinois had higher incomes, and their departure has not been offset by people of equivalent financial means entering the Land of Lincoln.
Undoubtedly, families are leaving Illinois for many reasons besides the 2011 tax hikes. For example, the hundreds of thousands of unemployed Illinoisans are not directly affected by the income-tax rate because they don’t have any income, but they certainly have reason to leave – chief among them, a lack of jobs. And formerly unemployed Illinoisans like Jesse Huerta say they’re doing just that: leaving for better opportunities elsewhere.
It takes time for policy changes to fully take effect. This time lag is known as “outside lag.” The migration effect of the 2011 income-tax hikes did not appear immediately, but when it manifested, it was dramatic: Illinois hemorrhaged income in the 2012, 2013 and 2014 tax years.
Young workers leading exodus
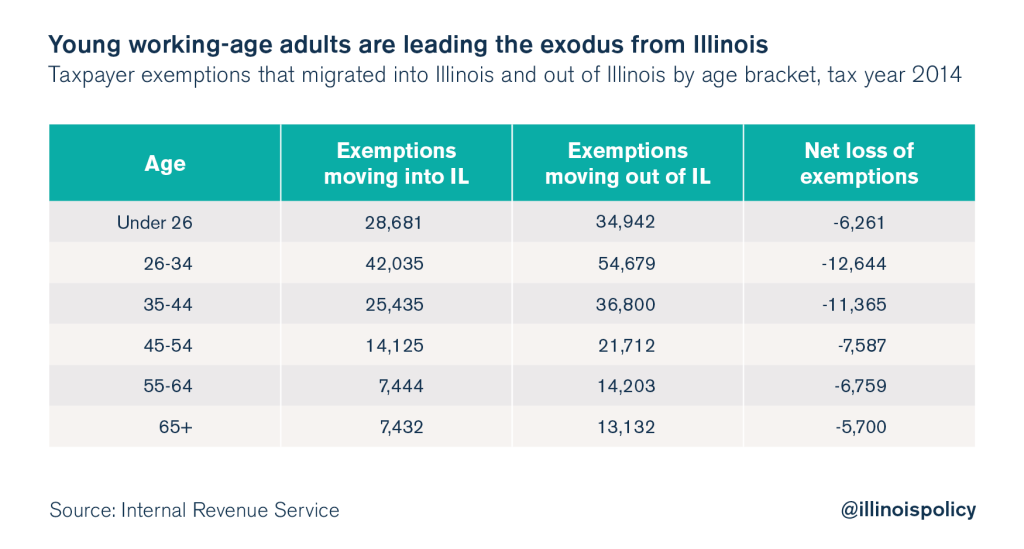
Young working-age adults again led the Illinois exodus. The age group with the largest loss of taxpayers was the 26-34-year-old cohort, followed next by those ages 35-44. Young taxpayers under 26 years old also showed large losses relative to previous years. The IRS data echo a recent poll from the Paul Simon Public Policy Institute, which found a majority of adults under age 50 want to leave the state.

States gaining people and income from Illinois
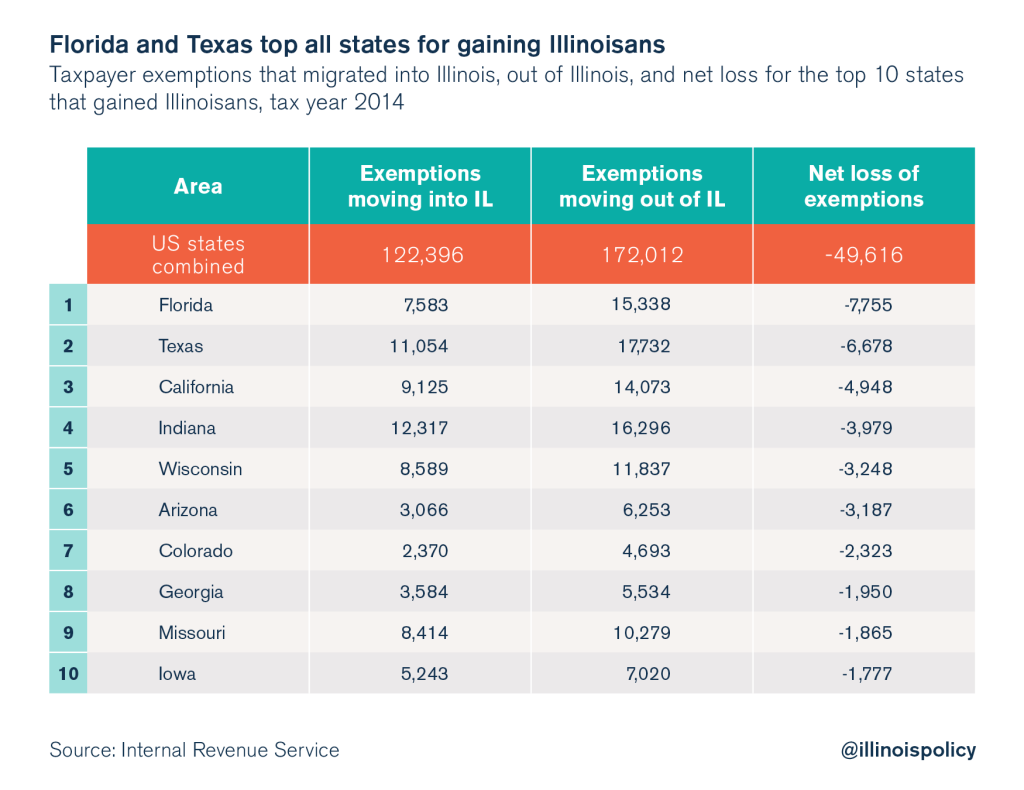
The overall rate of migration for taxpayers moving both into and out of Illinois declined in 2014, compared with 2013 levels. On the whole, Illinois sustained a net loss of 26,000 tax returns on the year, representing a net loss of 50,000 total people (tax exemptions). The top states to gain people from Illinois were the usual suspects: Florida, Texas, California, Indiana and Wisconsin. And once again, Illinois experienced net migration losses with respect to every state in the Midwest.

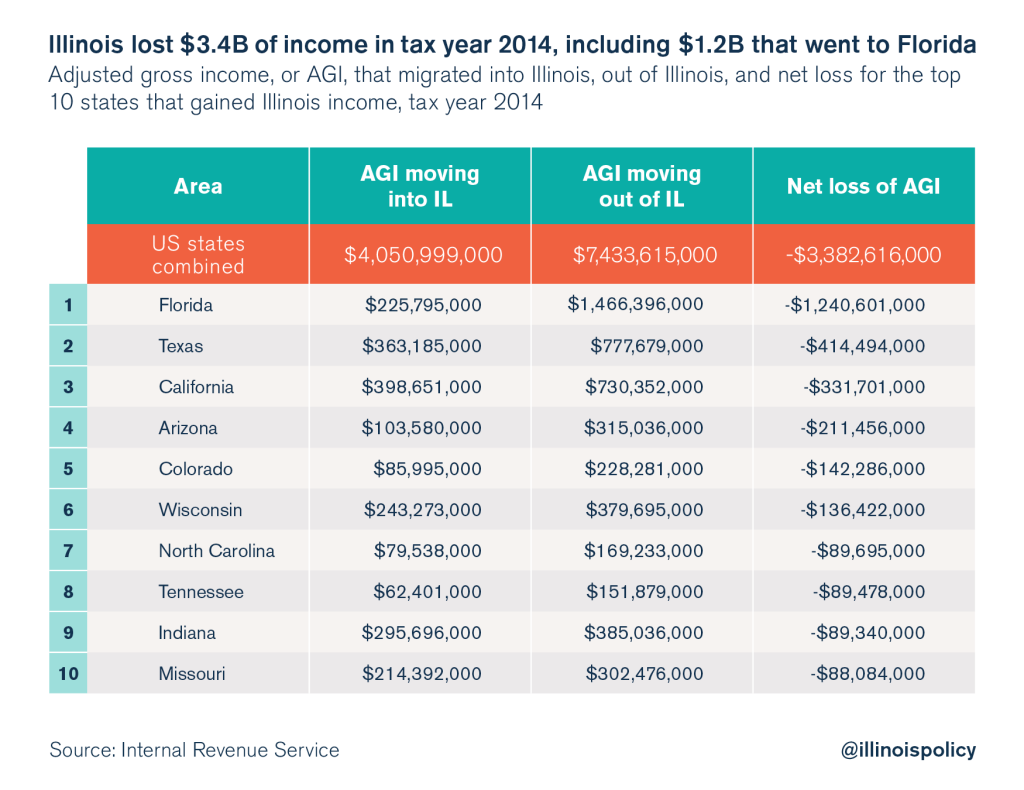
Illinois’ net loss of taxpayers and people in 2014 looked almost identical to the 2011 tax year losses. But the state’s net loss of adjusted gross income, or AGI, looked very different. In 2011, Illinois had a net loss of 24,000 tax returns, 50,000 people, and $2.5 billion of AGI. And in 2014, Illinois had a net loss of 26,000 tax returns and 50,000 people, but with a net loss of $3.4 billion in AGI. Florida was the biggest net recipient of Illinois earning power, followed by Texas, California, Arizona and Colorado.
 The characteristics of Illinois out-migrants should be very concerning to state lawmakers. First, out-migrants from Illinois tend to be young and working-age adults. These are taxpayers in the beginning and middle of their careers whom Illinois desperately needs, both to maintain the state’s economic power and to cover an ever-increasing tax bill.
Second, Illinois is trading higher earners for lower earners. The average income level of out-migrants has risen, while the average income level of in-migrants has been relatively flat.
Finally, Illinois has experienced net migration losses with every state in the Midwest for four consecutive years. When people vote with their feet, they choose every other state in the region over Illinois. This fact speaks volumes about Illinois’ relative decline, and should jolt politicians into getting the state’s fiscal house in order, enacting job-creating reforms, and making the Land of Lincoln a place people want to call home.
