Chicago’s deepening financial crisis has sparked a public debate about the solutions the city needs to implement.
What has been missing from the conversation, however, is a perspective that takes into account the city’s overall tax structure, revenue landscape and the tax burdens borne by the people of Chicago.
Some argue higher taxes are necessary to fix Chicago’s crisis. Tax-hike proponents insist that because Chicago’s property-tax rates are low relative to the suburbs and surrounding counties, an increase in property taxes is justified.
However, that comparison is inapt. Chicago’s suburbs and the collar counties have some of the highest property taxes in the nation. A more appropriate measure – comparing Chicago to other large cities across the country – shows that Chicago property taxes are actually quite high.
Tax-hike proponents also claim that Chicago has not raised taxes significantly in recent years. This, they contend, justifies any future property-tax increases by the city.
This argument omits the multitude of other local taxes that already make Chicagoans the most-taxed residents of any major city in Illinois.
Tax-hike proponents also argue that the fiscal crisis stems from the city’s reduced revenue stream and that current revenues are inadequate to meet the city’s needs.
But the city’s budget shows Chicago has never had more money to spend. In fact, the city has over $1 billion in additional revenue today when compared to what it would have if Chicago’s revenue had grown at the rate of inflation over the past 20 years.
This report assesses each argument by examining readily available financial and demographic data for Chicago and municipalities within the state of Illinois and across the U.S.
It evaluates the role property taxes play within the context of the total revenue stream of the city, and it enumerates important categories of revenue and recent increases in taxes.1
Furthermore, it compares Chicago’s revenue data to that of other large municipalities in Illinois and the U.S., including other analyses of how competitive or uncompetitive Chicago’s tax structure is.
Finally, the report explores how Chicago’s revenue picture and the subsequent tax burden on its residents have changed in recent history.
Property-tax revenue relative to Chicago’s overall revenue
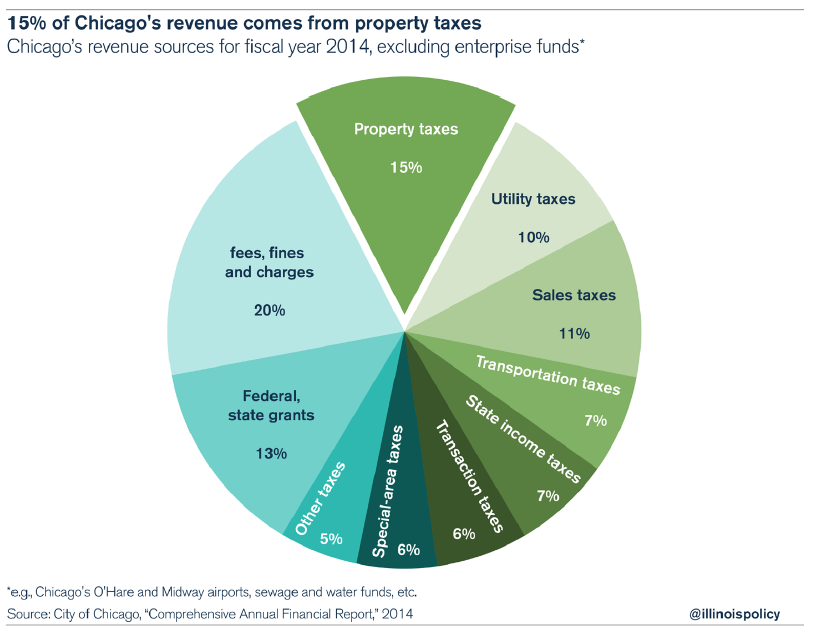
Contrary to the finances of other municipalities, Chicago property taxes account for only 15 percent of the revenue flow to the city (excluding enterprise funds such as O’Hare and Midway airports, water and sewer funds, etc.), according to the city’s Comprehensive Annual Financial Report, or CAFR, for 2014.2 However, that does not mean Chicago is suffering from a lack of revenue, as will be shown later in this analysis. Instead, Chicago relies more heavily on other sources of revenue when compared to other major Illinois cities.
Other sources for the city’s $6.05 billion in revenues include utility taxes (10 percent); sales tax (11 percent); transportation taxes (7 percent); state income taxes (7 percent); transaction taxes (6 percent); special-area taxes (6 percent); fees, fines and charges (20 percent); federal and state grants (13 percent); and other taxes (5 percent).
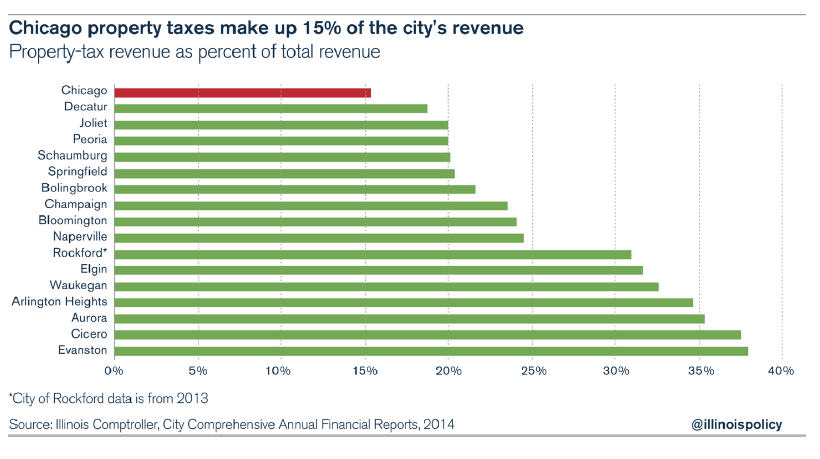
When compared to the largest municipalities in Illinois, defined as communities with populations over 70,000, Chicago relies less on property taxes than every other large municipality.3
For example, Chicago’s percentage of revenue from property taxes (15 percent) is low compared to what the remaining 16 large municipalities receive from property taxes. Property-tax revenue for these municipalities constitutes an average of 27 percent of the total revenue, nearly double the percentage for Chicago. The percentages for the other municipalities range from 19 percent for Decatur to 38 percent for Cicero. The median is 24 percent.
Chicago’s property taxes relative to property taxes in the collar counties
Property taxes in Chicago are lower than property taxes in the surrounding counties. However, the usefulness of that comparison is limited because the collar counties have some of the highest and least affordable property taxes in the nation.
According to a study of 806 counties across the U.S. by the nonpartisan Tax Foundation, Lake, McHenry, Kane, DuPage, Will and Kendall counties had the 16th, 25th, 26th, 32nd, 38th and 37th highest property-tax rates in the nation when measuring the cost of the property tax paid relative to the median household income in 2010.4
Another way to measure property taxes is as a percentage of home value. For the collar counties, the median property tax paid was a minimum of two and a half times greater than the median for the United States, and at least twice the national percentage when measuring the median property tax paid relative to median income.
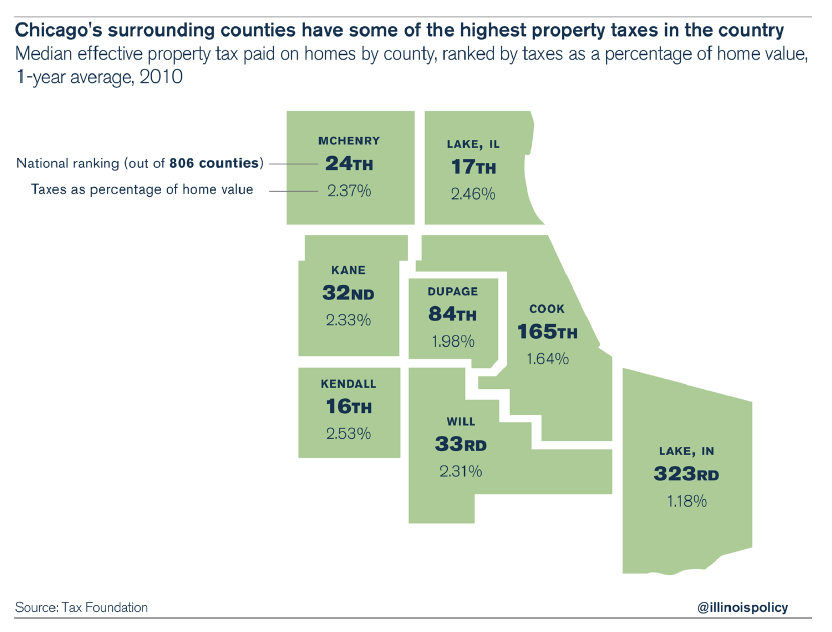
The collar counties’ property-tax rankings are far higher than those of neighboring Lake County, Indiana, where effective property taxes ranked 323rd in the nation.
The data suggest instead that it’s not Chicago’s property taxes that are low, but rather that suburban property taxes are some of the highest in the U.S.
Therefore, it is a logical fallacy to claim that Chicago’s property taxes are low merely because they are lower than those paid by residents in the collar counties.
A more fitting comparison: Chicago’s property taxes compared to property taxes in other major U.S. cities
A more fitting comparison is to look at Chicago’s property taxes relative to property taxes for other large cities in the United States. Using this metric, Chicago taxes property at a high rate.
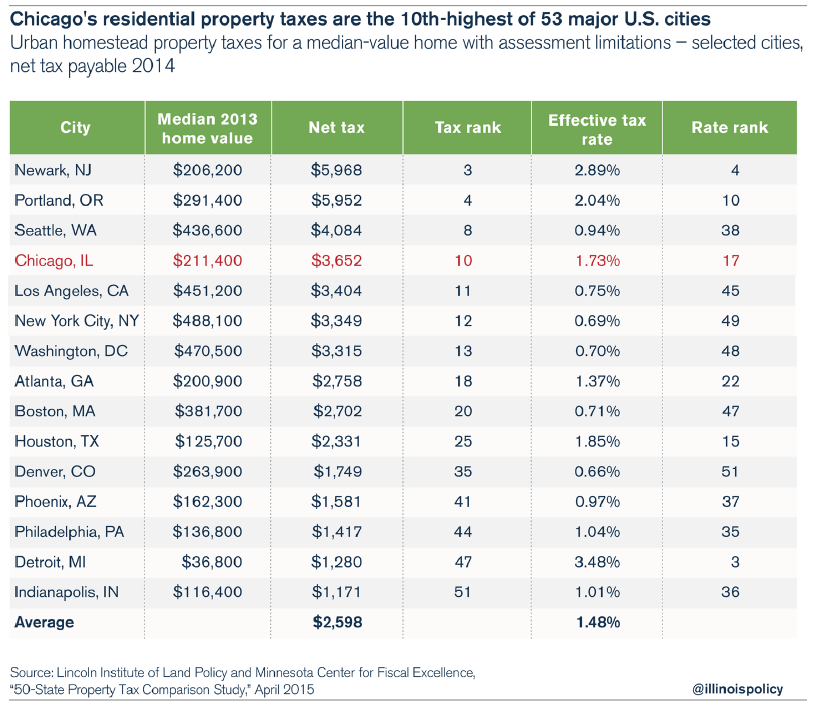
According to a study by the Lincoln Institute of Land Policy and the Minnesota Center for Fiscal Excellence,5 Chicago had the 10th-highest net residential property tax paid for a home of median value in 2013.6
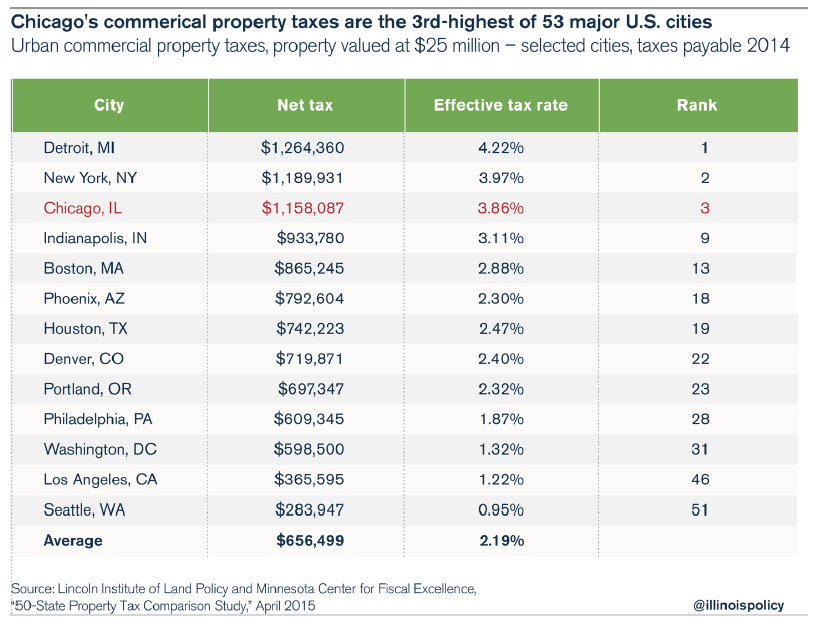
In addition, Chicago had the third-highest commercial property-tax rate.
Chicago’s residential property tax paid relative to median home value was 41 percent higher than the average of all 53 municipalities studied by the Lincoln Institute of Land Policy and the Minnesota Center for Fiscal Excellence. And Chicagoans paid commercial property taxes that were 76 percent to 84 percent higher than those in all 53 municipalities, depending on the assumed value of the commercial property.
The components of Chicago’s oppressive tax burden
Property taxes don’t tell a complete story about the tax burden Chicagoans face. In addition to property taxes, Chicago imposes more than 30 other taxes. The list of taxes can be found in Appendix A.
One of the primary non-property taxes from which the city benefits is a sales tax. The state charges a 6.25 percent tax on the sale and use of most goods. Two exceptions are food and medicine, which are taxed at 1 percent. The state keeps 5 percent for itself and pays the remaining 1.25 percent to local governments.7
The city also levies its own tax of 2.25 percent on those same items. In 2014, Chicago received $658.8 million from the sales tax: $334.5 million from the state and $324.3 million from its own tax.8
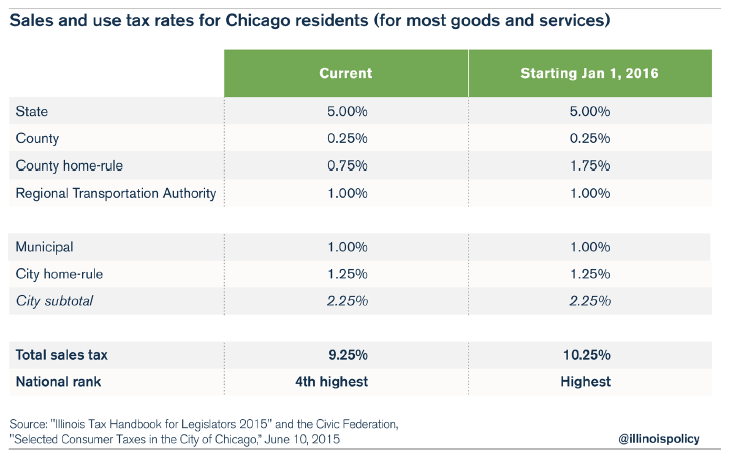
Added together, the various components of the sales tax equal a rate of 9.25 percent, the fourth highest in the nation9 when measured against comparable cities with populations over 200,000. However, due to the Cook County Board’s voting to increase the county’s sales-tax rate by another 1 percent, Chicago will have the highest sales tax in the nation starting on Jan. 1, 2016, assuming other municipalities do not increase their taxes above Chicago’s in the meantime.10
Chicago also benefits from the state income tax. Through Jan. 31, 2015, the state transferred 6 percent of the revenue from individual income taxes and 6.86 percent of the corporate income-tax revenue to the Local Government Distributive Fund, a revenue-sharing mechanism that redistributes state taxpayer dollars to local governments across Illinois. On Feb. 1, 2015, the state began transferring 8 percent of the individual income-tax revenue and 9.14 percent of the corporate income-tax revenue to the fund.11 Along with all municipalities, Chicago benefits from this distribution, and Chicago received $404 million from this source in 2014.12
The city also imposes a restaurant tax of 0.25 percent on top of the sales tax, making the current tax rate for eating out 9.5 percent or 10.5 percent,depending on whether a customer dines in the district subject to the 1 percent tax by the Metropolitan Pier and Exposition Authority.13 On Jan. 1, 2016, these rates will increase to 10.5 percent and 11.5 percent.
Chicago also heavily taxes automobiles. Owners of small passenger vehicles must pay an annual tax of $185, of which $86 goes to the city. Owners of large passenger vehicles must pay $234 each year, and $137 of this goes to the city.
Parking is taxed from 26 percent to 31 percent, with most of the proceeds going to the city and the remainder going to Cook County. Chicago taxes gasoline at 50 cents per gallon and keeps 10 percent of this amount. Diesel fuel is taxed at 58 cents per gallon. Car-rental costs include a $2.75 tax per rental period, and the purchase of new tires is taxed at $1 per tire.14
Chicago taxes alcohol at $0.29 to $2.68 per gallon, bringing the combined federal, state and local tax to $0.83 to $27.23 per gallon, depending on the type of drink and the alcohol content. Soft drinks are taxed an additional 3 percent above the sales tax, and bottled water is taxed 5 cents per bottle.15
The city also heavily taxes tobacco products. Chicago’s $1.18 tax on each pack of cigarettes sold brings the total tax to $7.17 per pack.16
Chicago also taxes cable television, electricity, natural gas, landline phones, cell phones, hotels, amusements and even the selling and buying of real property.17
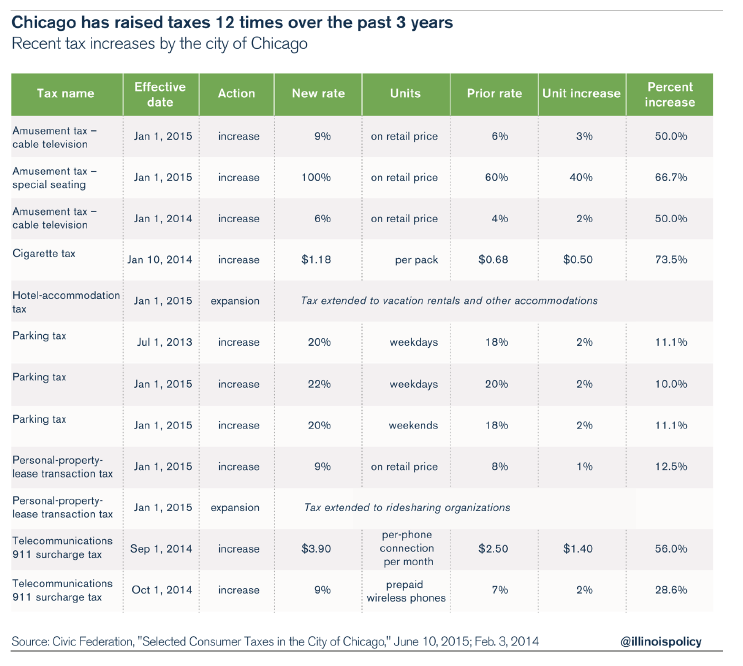
Some analysts have argued that it may be time for Chicago to raise its property taxes because it has not increased them for many years. This argument ignores the fact that the city has been increasing taxes all along – just not property taxes. In fact, over the past two years, the city of Chicago increased or expanded taxes 12 times.
Chicago’s revenue growth over time
Some proponents of tax hikes have suggested that the city’s financial problems derive from a lack of revenue. However, data from Chicago’s CAFRs18 show that revenue to the city of Chicago has climbed steadily since 1994.19
Although the data show that city revenue has fluctuated at times, the overall trend has been an upward progression through fiscal year 2014, the most recent year of data available through the CAFRs.
Remarkably, revenue in 2014 reached $6.05 billion, the highest on record.
The two sources of greatest growth were local taxes other than property taxes, and fees and charges (i.e., other local revenue). The city collected record amounts under these two categories in 2014: $3.1 billion for other taxes and $1.2 billion for fees and charges.
Property-tax collections, however, were highest in 2012, at $941 million, compared to $930 million in 2014. And revenue from federal and state grants reached $1.1 billion in 2002, compared to $812 million in 2014.
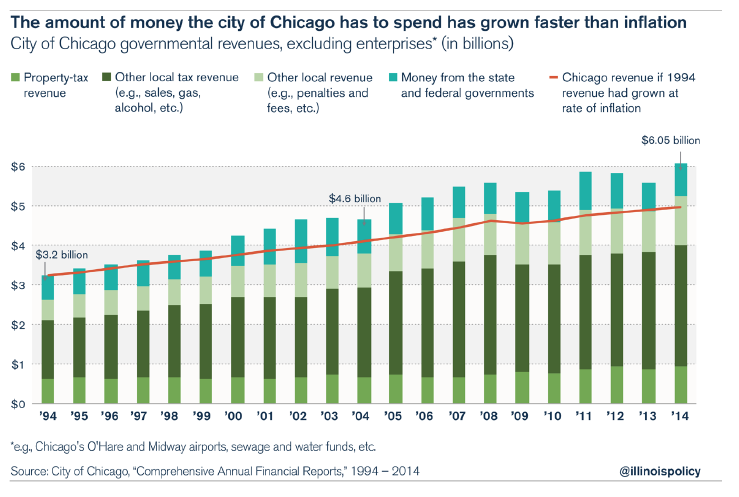
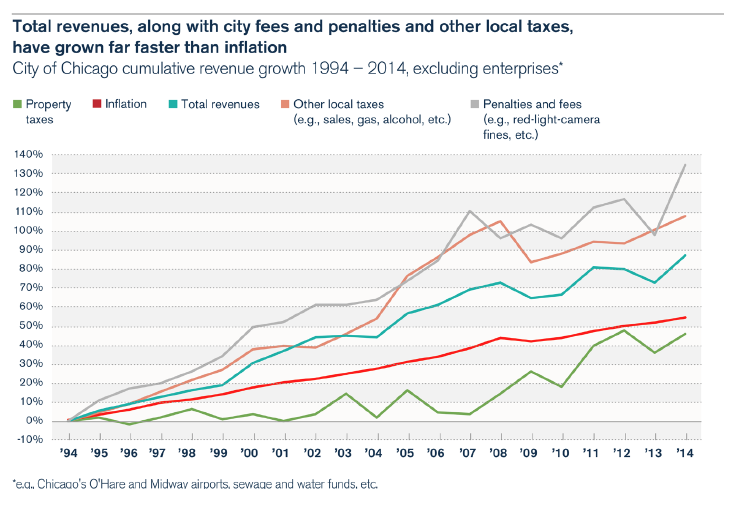
Revenue growth also exceeded the general growth in prices as measured by the consumer price index for the Chicago, Illinois-Gary, Indiana-Kenosha, Wisconsin area.20 Chicago had $1.1 billion more in revenue than it had in 1994 after adjusting for inflation.
Overall revenue grew by 87 percent, while general prices increased by only 54 percent. Although property-tax revenue barely kept up with inflation, other categories of revenue more than doubled. More precisely, non-property-tax revenue increased by 108 percent, and fees and charges grew even more rapidly at 135 percent.
Federal and state grants are included in the analysis because these grants become part of the revenue stream that enables the city’s operations. These grants are distinct from the many state and federal spending programs, and are given to the city for general operations or for specific purposes, such as the police department or public works on streets and roads.
If Chicago did not receive these federal and states grants, then the city would need to raise additional revenue from local taxes and fees to continue the functions supported by those grants. Excluding those grants from the analysis yields the same results. Chicago has the highest per-capita local tax and other revenue burden of any major Illinois city.
Federal and state grants have varied from 12.7 percent of revenue in 2013 to 23.4 percent of revenue in 2002. The decrease in the percentage of federal and state grants in the overall budget in recent years is due to both the city’s receiving less grant money and the growth in other categories of revenue.
Revenue growth, then, is not the source of Chicago’s fiscal problems. Chicago had record revenue in 2014, and revenue growth has outpaced inflation over the past 20 years.
Chicago’s per-capita revenue compared to per-capita revenue in Illinois’ largest municipalities
Not only does Chicago now have record revenues, but its revenues are also higher than those of other big cities in Illinois.
When equalized on a per-capita basis, the city of Chicago takes in far more revenue than any other major city (municipalities with populations over 70,000) in Illinois.21
Ranked by population according to the 2014 estimates by the U.S. Census Bureau, the 17 largest municipalities in Illinois are: Chicago (2,722,389), Aurora (200,456), Rockford (149,123), Joliet (147,928), Naperville (146,128), Springfield (116,809), Peoria (115,828), Elgin (111,117), Waukegan (88,915), Champaign (84,513), Cicero (84,354), Bloomington (78,730), Arlington Heights (76,024), Evanston (75,658), Schaumburg (74,896), Bolingbrook (74,180) and Decatur (74,010).22
Only the revenue identified as general, special, capital project or debt service was used in the analysis. Revenue for enterprises, internal services, fiduciary and “discretely presented component units” was excluded because including these sources would distort the findings. Enterprise and internal service funds are proprietary funds and include enterprises such as O’Hare International Airport in Chicago and the electric light and power fund in Springfield.
Fiduciary funds are those funds held by a municipality as an agent in a fiduciary capacity, such as retirement funds for the benefit of employees.
Discretely presented component units are those activities that are reported separately and have their own funding sources. These may include libraries or other independently operating functions.
The assumption used in the analysis is that all municipalities correctly filled out their financial reports, thus making the comparison consistent across those municipalities. No further auditing was performed to ensure accuracy.
Additionally, because 2014 data for Rockford at the time of extraction was unavailable, 2013 data were used instead. The 2014 Rockford data, once available, may affect Rockford’s ranking among the other municipalities, but the difference should not be significant, especially relative to the subject case, the city of Chicago.
The cities’ revenue sources used in the analysis follow the reporting requirements by the Illinois comptroller and are categorized as follows:
- property-tax revenues,
- other local tax revenues
- other local revenues,
- state revenue and grants, and
- federal revenue
Per-capita revenue – derived simply by dividing each revenue category by the population of each respective municipality – is used as a basis of comparison to help reduce the distortion that population size would otherwise create in the comparison. Although imperfect, per-capita revenue also provides an indicator of the overall revenue burden, which is analogous to the tax burden, excepting grants, because revenue must exceed expenditures over the long run. The deficits accrued by any municipality in 2014 are not shown because the analysis is focused on available funds that enable a municipality to carry out its governmental functions other than enterprises.
Similarly, per-capita revenue provides an indicator of the efficiency of a municipality, assuming that revenue approximates expenditures. It may be argued that Chicago – because of its enormous size – has needs beyond those of other municipalities, and this may be a reasonable statement considering the challenges major urban centers face. However, larger municipalities also have economies of scale, thus reducing some of the differences.
Furthermore, poor historic spending behavior plays an important role in the current fiscal situation. Further study would be needed to properly explain and put in perspective the fiscal situation vis-à-vis these factors.
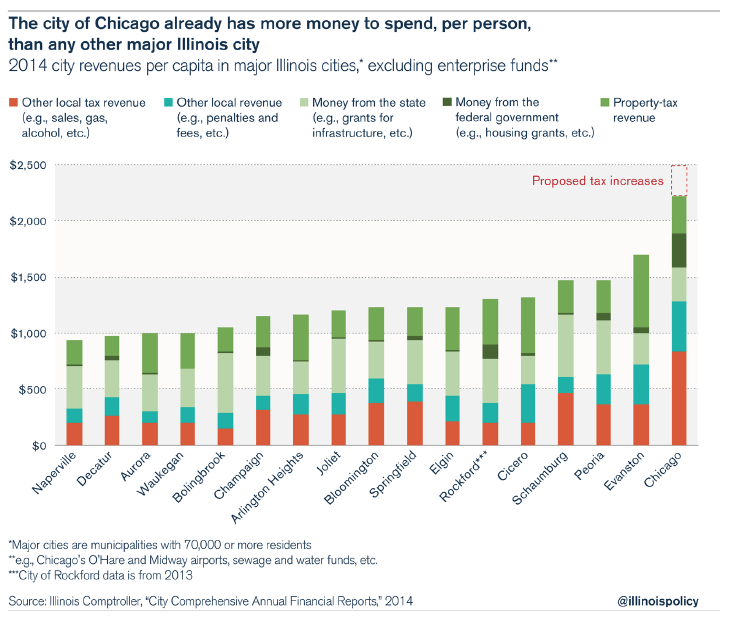
The data show that Chicago receives significantly more revenue on a per-capita basis than any of the other large municipalities analyzed. In fact, Chicago takes in $2,222 for each resident, which is $528 or 31 percent more than Evanston, the municipality with the second highest per-capita revenue. When compared to Naperville, Chicago collects over double, that is, $1,284, or 137 percent more.
For three of the five categories of revenue, Chicago receives the most per-capita revenue among Illinois’ largest municipalities. When compared to the municipality with the second highest per-capita revenue, Chicago receives 75 percent more in other local taxes, 25 percent more in nonproperty local revenue, and 24 percent more in federal funds.
These rankings make up for the fact that Chicago ranks seventh in terms of per-capita property- tax revenue and 14th in terms of state revenue and grants. When compared to the average of the 16 other municipalities, Chicago receives 196 percent more in non-property local taxes, 137 percent more in fees and other revenue, and 844 percent more in federal revenue.
Chicago’s per-capita tax burden compared to the tax burdens in Illinois’ largest municipalities
When nontax and fee sources of revenue, such as state and federal grants, are removed from analysis, the disparity between Chicago and Illinois’ other major cities grows larger.
In fact, with their current tax burden, Chicagoans are the most-taxed residents of any major city in Illinois.
Chicagoans pay three times more in local taxes and fees than Naperville residents, twice as much as those in Rockford, and nearly 20 percent more than the residents of Evanston.
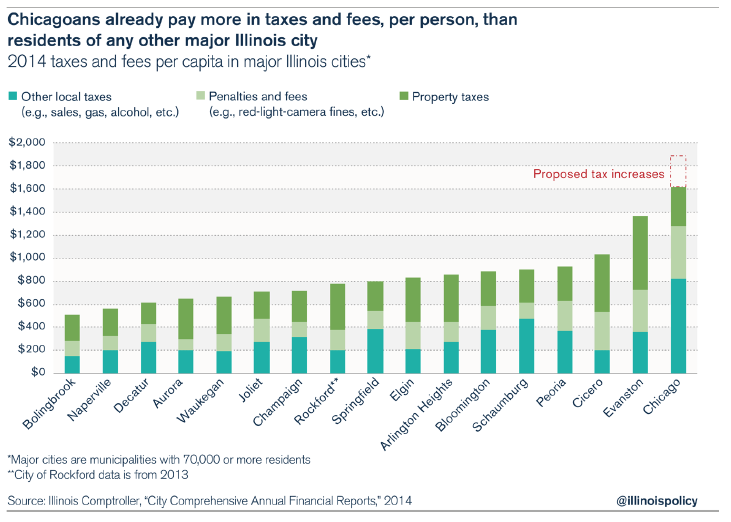
The high burden of other taxes and fees in Chicago is the reason why property taxes should not be viewed in isolation when comparing the city to the surrounding suburbs. When all taxes and fees are combined, Chicago’s true tax burden becomes apparent.
Chicago’s tax burden over time
A general indicator used by economists to determine tax burden is to divide total tax revenue by the population. The indicator is general because it reflects the burden on the population as a whole and does not necessarily reveal a particular individual taxpayer’s or a particular family’s tax burden.
Nonetheless, when used over time, this indicator provides good information on the direction of the general tax burden, i.e., whether the burden is increasing or decreasing. Prior to conducting this analysis, it is important to compare the population to the number of households. As long as household size remains fairly stable, it is a useful measure.
In Chicago’s case, population growth has fluctuated within a narrow margin, and household size has remained fairly constant. Between the 1990 and 2000 censuses, Chicago’s population grew 4 percent, while household size remained constant. Between the 2000 and 2010 censuses, Chicago lost 7 percent of its population, while its household size fell 5.5 percent.23
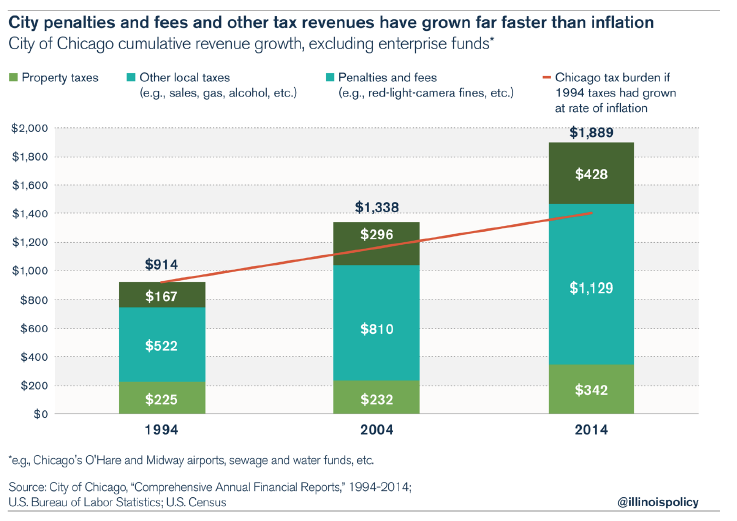
The data show that Chicago’s per-capita burden of taxes, fees and other charges has doubled over the last 20 years: from $914 in 1994, to $1,338 in 2004, to $1,889 in 2014.24
Over the same three benchmark years, the per-capita property-tax burden has risen from $225 in 1994, to $232 in 2004, to $342 in 2014. Other taxes on a per-capita basis have more than doubled, from $522 in 1994, to $810 in 2004, to $1,129 in 2014. Per-capita fees and miscellaneous penalties, excluding investment income, have nearly tripled over this time period: from $167 in 1994, to $296 in 2004, to $428 in 2014.
Even when adjusting for inflation, the tax burden on Chicagoans has increased substantially. Had the per-capita tax burden in 1994 grown at the rate of inflation, it would have been $1,406 in 2014, compared to the actual amount of $1,889. Therefore, the per-capita burden, after adjusting for inflation, has grown by $493 per person and was 35 percent higher in 2014 than what it was in 1994. The consumer price index for the Chicago, Illinois-Gary, Indiana-Kenosha, Wisconsin area, as published by the U.S. Bureau of Statistics, was used to calculate the rise in general prices.
Summary and conclusion
In summary, while it’s true that Chicago’s property taxes are lower than those in collar counties such as Kane and DuPage, that’s mainly due to the fact that property taxes in the collar counties are among the highest in the nation.
Compared to other major cities across the U.S., Chicago’s property taxes are 10th-highest for residential properties and the third highest for commercial properties.
In all, property taxes account for only 15 percent of all revenue for the city of Chicago, far less than every other municipality evaluated. To make up the difference, Chicago relies far more on other taxes, such as gas, sales and amusement taxes – totaling more than 30 in number – and receives more revenue from these sources than any other municipality studied. Some of these taxes are extremely high compared to those in other localities.
Furthermore, Chicago has increased or expanded taxes 12 times just since 2013. Making the issue more complex, many of Chicago’s taxes are imposed on the same tax bases as federal, state, county and other local-government-entity taxes, making the combined tax rates high, and in some cases, among the highest in the nation. For example, Chicago will have the highest sales tax in the U.S. as of Jan. 1, 2016.
Although there are some annual fluctuations, city revenue has grown steadily since 1994. In fact, revenue growth has significantly outpaced inflation, resulting in more revenue available to the city today than at any time in the past twenty years. When comparisons are equalized on a per-capita basis, Chicago’s tax burden has grown significantly over this time, even after adjusting for inflation.
No large municipality in Illinois even comes close to Chicago in the amount of revenue received, on a per-capita basis, or the amount of taxes collected.
In total, Chicagoans carry the highest tax burden of residents of any major municipality in Illinois, and the city of Chicago has never had more revenue to spend.
Before the Chicago City Council votes to raise taxes even higher than they are today, it must address the imbalance in the city’s fiscal situation by focusing on the other side of the ledger. The City Council must find ways to reduce expenditures and reform the way Chicago operates. Moving new city workers into 401(k)-style retirement plans and opening up city contracts to find additional reforms is a vital first step in that process.
Ultimately, the city needs to look for ways to deliver governmental services more efficiently and to reduce the tax burden on its residents.