Education finance solutions
By Ted Dabrowski, John Klingner
Education finance solutions
By Ted Dabrowski, John Klingner
Funding for education is one of the state’s highest priorities. It’s one of the only expenditures where increased funding is almost guaranteed each year, with billions of local, state and federal dollars going to fund students’ educations.
But education funding’s status as a high priority for the state hasn’t stopped some critics from claiming that Illinois’ education funding system is unfair and inadequate for many students. They claim that districts in the highest quartile for students in poverty spend far less than districts in other quartiles, and that the state’s formulas are unfair to property-poor districts.1 Those critics’ solution is to upend the state’s education funding formulas and spend billions more on education by hiking taxes on already overburdened taxpayers.
Not only are the above criticisms misleading, but by focusing solely on state aid and funding formulas, critics ignore the fundamental problems with Illinois’ education system, which has deprived students of classroom funding and pushed local property taxes to the highest in the nation.2
Those problems include: rising teachers’ pension costs that crowd out billions in state appropriations for classrooms; Illinois’ excessive number of districts and their costly administrations that siphon money away from students; and the system’s lack of accountability for those it is supposed to serve – Illinois’ parents and students.
The state’s funding formulas that provide state aid aren’t to blame for the problems with education, in fact:
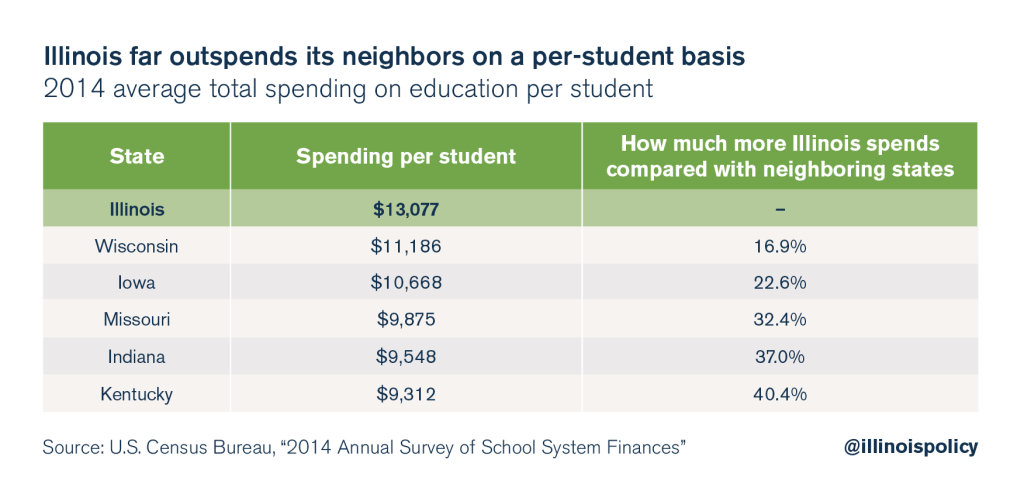
- Illinois is actually one of the nation’s biggest spenders on education. At $13,077 per student, Illinois spends the 13th-most of any state in the country – far more than any of its neighbors or any Midwestern state. Illinois spends 40 percent more than Kentucky, 37 percent more than Indiana, and 32 percent more than Missouri on education per student.3
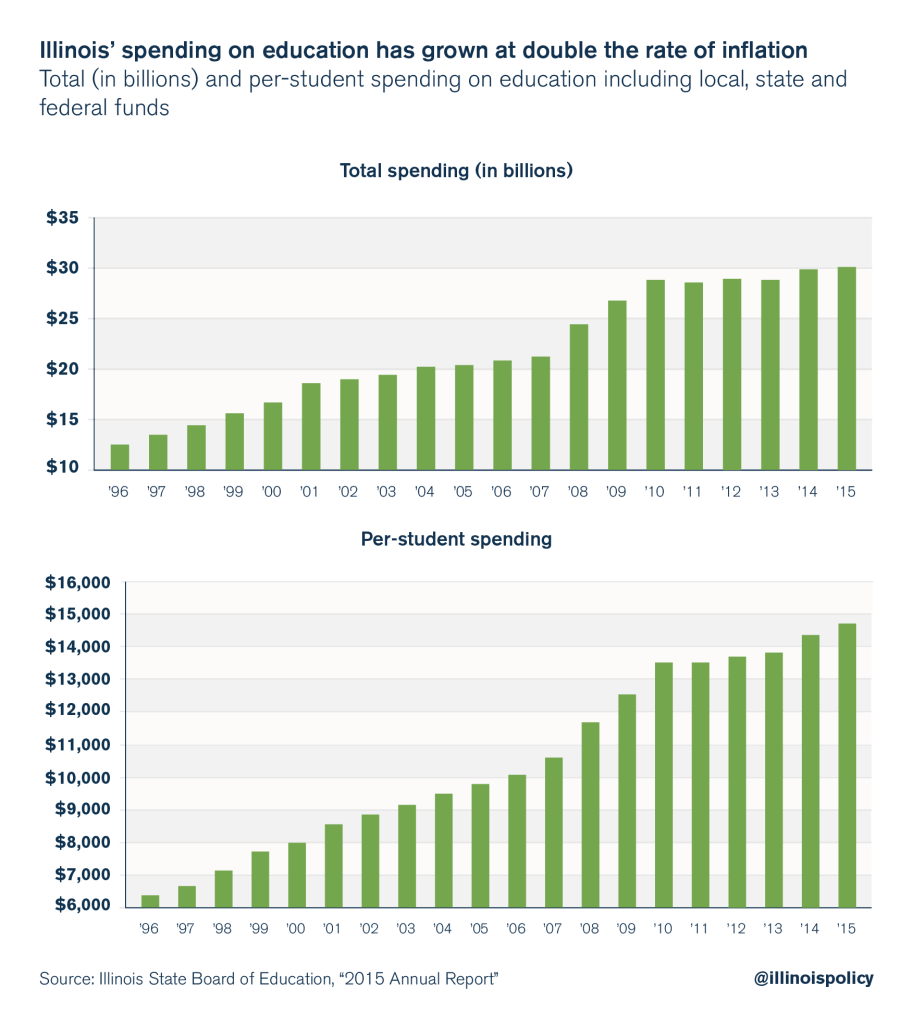
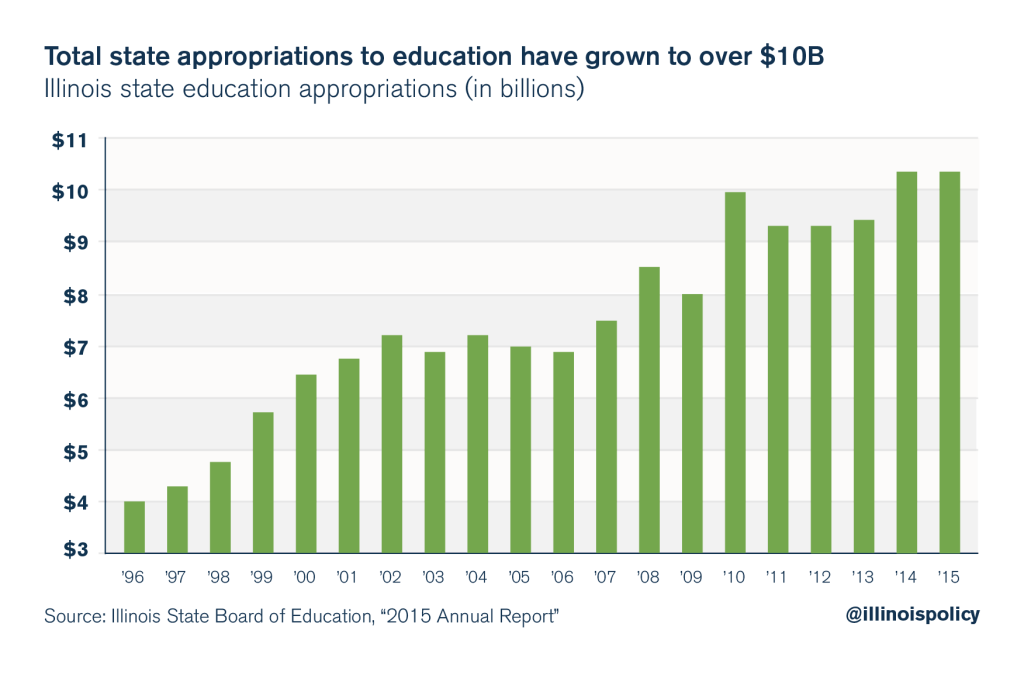
- The state’s total spending on education has grown at more than twice the rate of inflation over the past 20 years, to more than $10 billion in 2015 from $4 billion in 1996.4 Spending has grown 36 percent faster than state revenues and twice as fast as taxpayers’ incomes.
- The state’s progressive funding formulas overwhelmingly favor property-poor school districts.
- Property-poor Foundation districts in Illinois receive nearly 90 percent of the state’s $6.7 billion in funding.5 On average, poor districts receive 45 percent of their funding from the state.6
- In contrast, the state’s aid formulas require property-wealthy districts to depend on local revenues. Ninety-two percent of funding for Illinois’ 63 Flat Grant districts comes from local taxes. Just 3.6 percent of the Flat Grant districts’ funding comes from the state.7
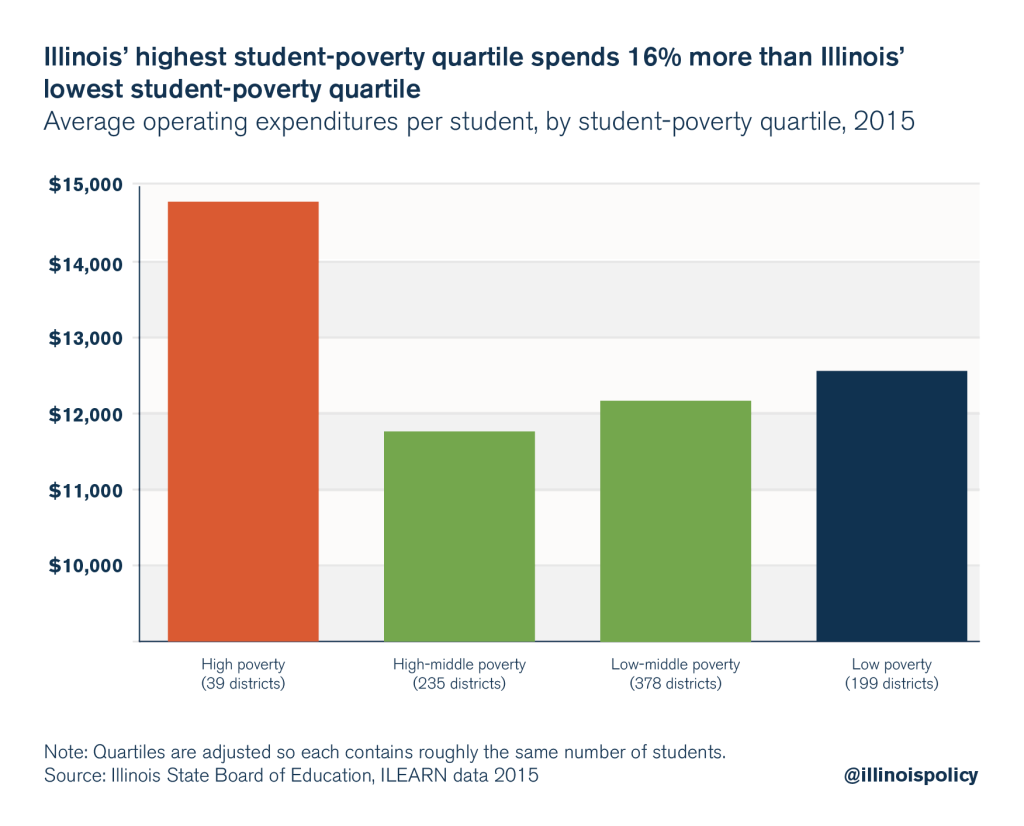
- Districts in the highest quartile for students in poverty spend 16 percent more per student than districts in the lowest quartile for students in poverty. The highest-poverty quartile spends $14,720 per student, while the lowest-poverty quartile spends $12,660.
Pouring billions of additional dollars into education, as some critics recommend, is not a solution either. The current system won’t stop growing pension and district administrative costs from swallowing that money.
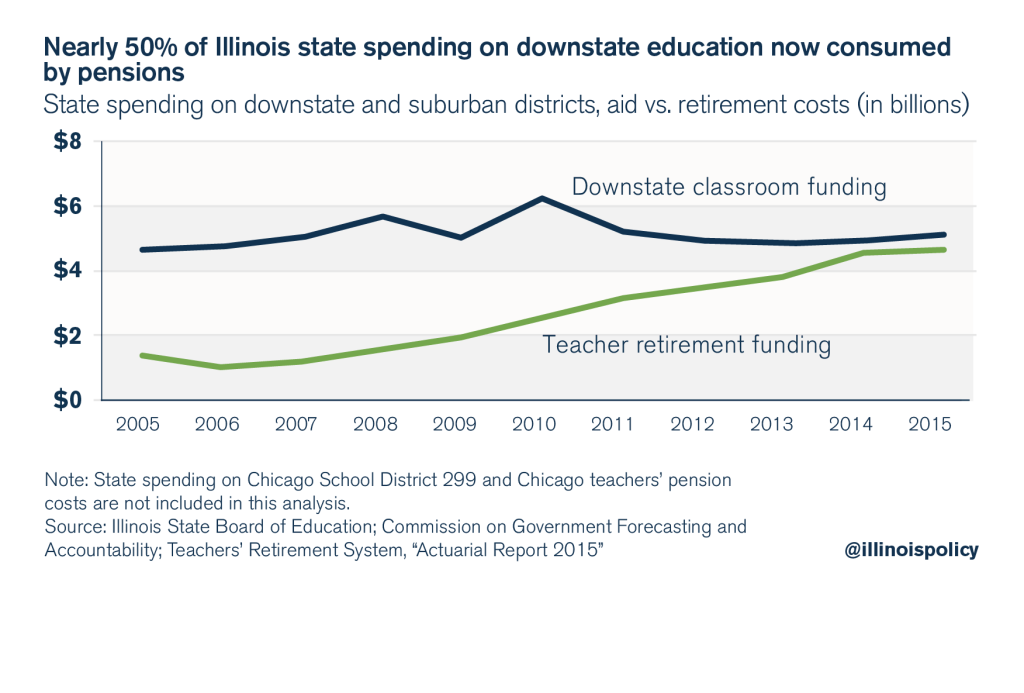
Teachers’ retirement costs already consume nearly half of all state appropriations to downstate education. Illinois spends more than $4 billion annually on retirements – more than what is spent on General State Aid.
Unless Illinois enacts reforms, pension costs will continue to crowd out funding meant for classrooms and students.
Compensation costs have taken money away from Illinois’ students as the number of administrators and staff at Illinois’ 859 school districts has grown. Between 1992 and 2009, the number of district administrators grew by 36 percent in Illinois, 2.5 times as fast as the growth in students.8 Today, there are over 9,000 top school administrators making six-figure salaries who will each receive $3 million or more in pension benefits over the course of their retirements.
Reducing the number of administrators through district consolidation could put hundreds of millions of dollars back into classrooms annually and save billions in pension costs over the next 30 years.9 (District consolidations would only involve combining/eliminating administrative positions; they would not close schools.)
Critics should focus on the above reforms so the resulting savings can be redirected toward state aid. Due to the progressive nature of the state’s funding formulas, Illinois’ poorest students would benefit the most from those funds.
Freeing up existing state dollars through teacher retirement reform and school district consolidation is important to fixing education in Illinois, but such reforms still only focus on improving inputs. Spending billions of additional dollars on students’ education won’t change how effectively or responsibly those dollars are spent.
Illinois lawmakers must also focus on improving outcomes for Illinois’ students. That will require fundamental changes to how Illinois delivers education to its students.
Increased accountability is the key to change. Parents must be empowered. They must be given greater control over the flow and distribution of education dollars and given the power to hold failing schools accountable.
Illinois education spending ranks highest in Midwest, 13th-highest nationally
Critics of Illinois’ current education funding system often ignore the fact that Illinois is one of the top- spending states in the country.
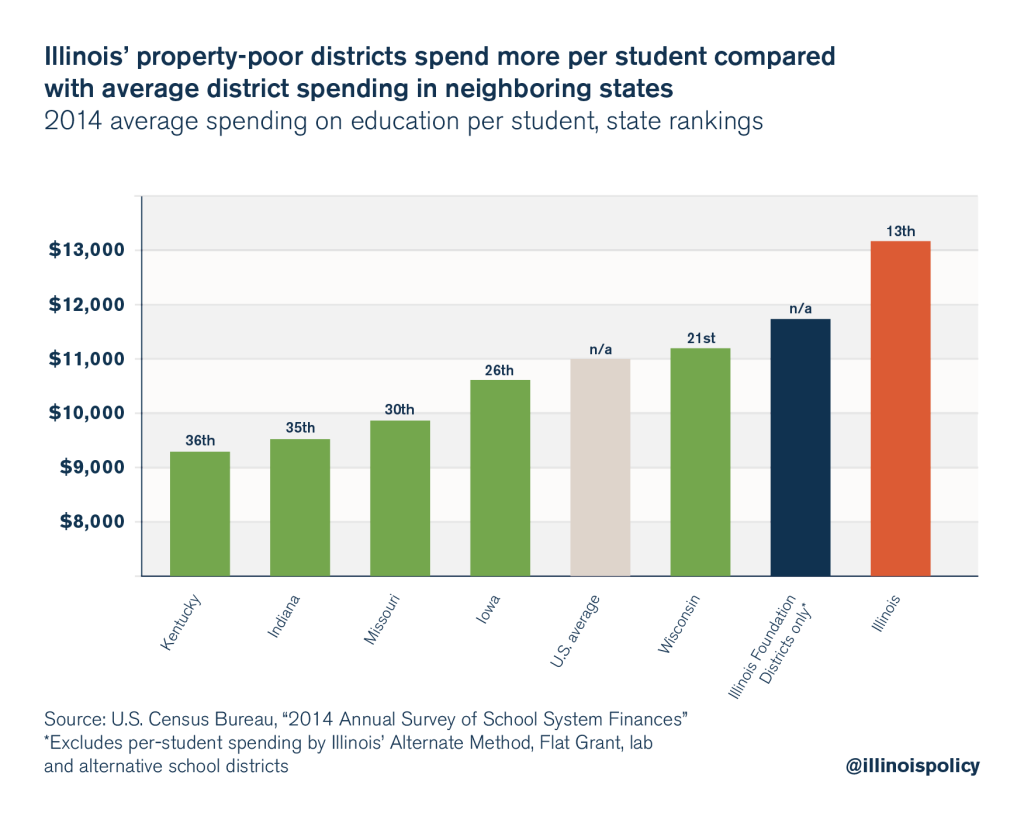
Illinois spends more on education per student than 37 other states. According to 2014 U.S. Census Bureau data, the most recent state-by-state comparison, Illinois spent on average $13,000 per student, the 13th- most in the nation. That amount is nearly 19 percent higher than the average spent nationally.10
In fact, Illinois spent more per student than every one of its neighboring states and more than any state in the Midwest.
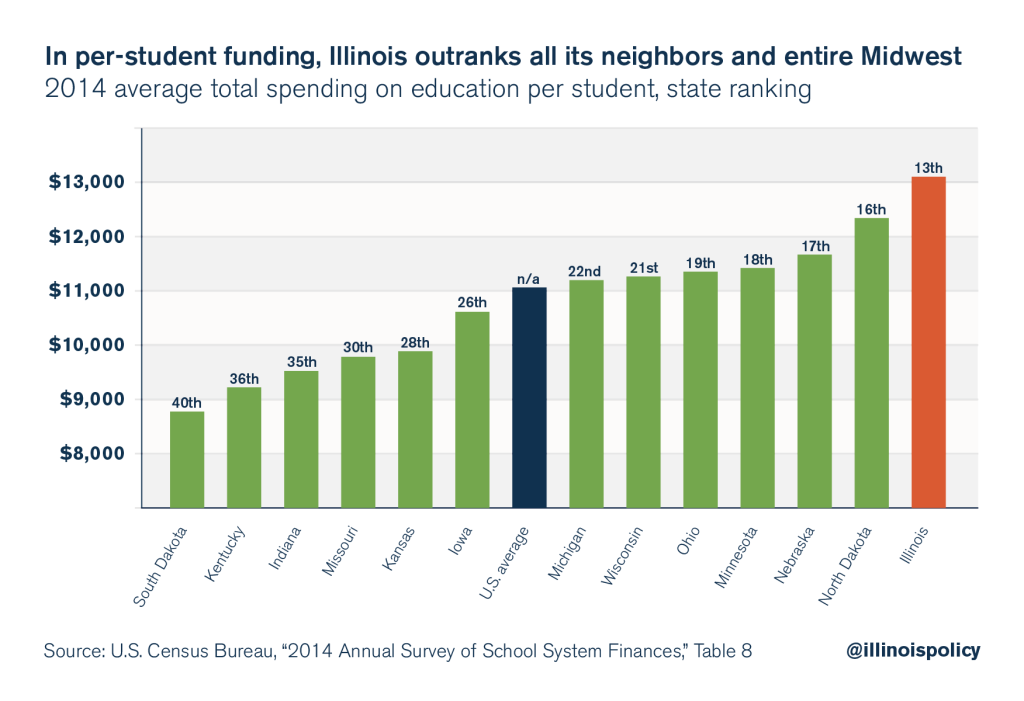
Illinois not only spends more than its neighbors, but it does so by considerable margins – 40 percent more than Kentucky, 37 percent more than Indiana, and 32 percent more than Missouri.
Illinois’ spending on education has grown consistently over the past two decades.
In fact, Illinois’ per-student spending has grown by 100 percent since 1996. The national average, by comparison, has grown by just 70 percent.
According to the Illinois State Board of Education, or ISBE, total education spending in Illinois (from local, state and federal sources) increased to more than $30 billion in 2015, compared with just $12.5 billion in 1996.11
Spending on education has grown at a rate of 4.75 percent a year since 1996, or more than 2.2 times the rate of inflation over those years.
ISBE data show similar growth in spending on a per-student basis.
Since 1996, per-student funding has grown at twice the rate of inflation, growing to $14,600 from $6,400.
And state spending, the focus of most critics’ concern, has grown even faster than total funding.
Total state appropriations have increased at 2.35 times the rate of inflation and exceeded $10 billion in 2015.12 That’s 36 percent faster than the growth in general state revenues and twice as fast as the growth in Illinoisans’ median household incomes over the same period.
The bottom line is that education in Illinois isn’t being shortchanged. Its problems lie in how that money is spent.
The state’s funding formulas are not the problem with Illinois education
Critics of Illinois’ current education system often claim that Illinois’ state funding formulas are unfair and that they favor the districts with the most property wealth.
They also claim that under the state’s funding formulas, many poorer districts are shortchanged. Several groups have promoted data showing that Illinois’ poorest quartile receives far less funding than the quartile with the fewest students in poverty.13
But the facts, based on the information directly from ISBE, show otherwise.
If the state formulas were unfair, a significant amount of state aid would go to property-rich districts, or the districts with the lowest property wealth would get limited support from the state.
But that is not the case. State aid for education flows almost entirely to Illinois’ poorest districts. And the top quartile of Illinois’ highest-poverty students receives more funding than the quartile with the lowest-poverty students.
Where state education funding goes
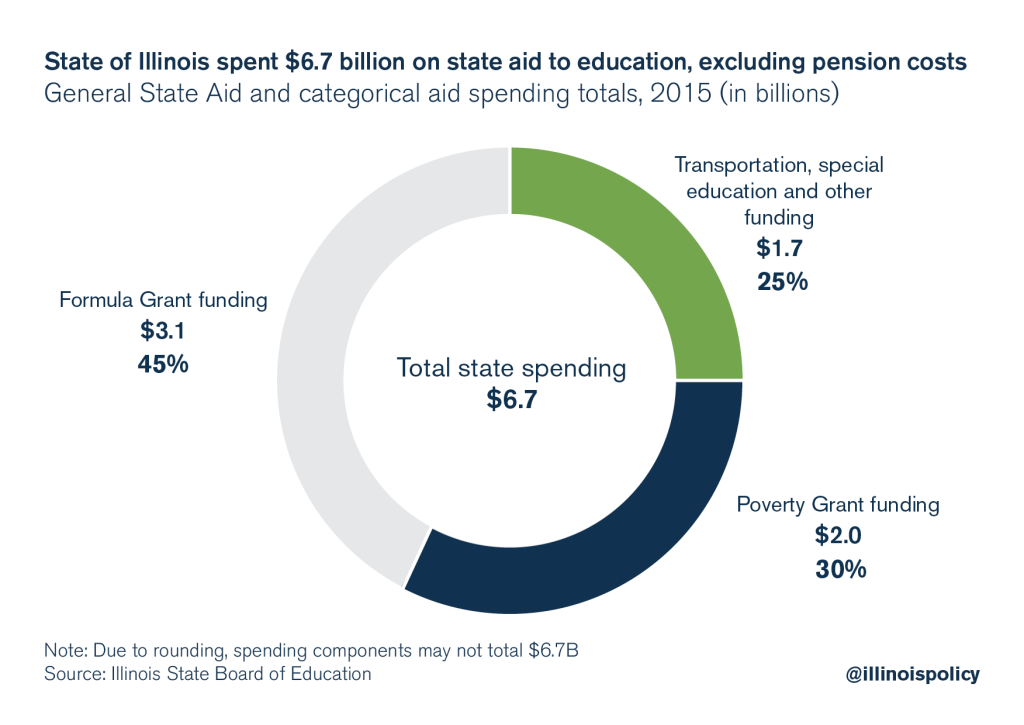
Illinois’ state government spent approximately $6.7 billion in state aid for education in 2015, not including the nearly $4 billion that went toward teacher pension costs.14
Over 45 percent of the state’s funding was distributed based on districts’ demonstrated need, the majority of which went to districts that lack the ability to adequately raise funds through local property taxes.
Nearly 30 percent was distributed based on the number of students deemed poor in a given district (based on both the number of children in poverty and the concentration of poverty in the district).
The remaining share of state funding, 25 percent, was distributed to pay for costs related to transportation, special education and other categories based on the number of students needing those services in each district.15
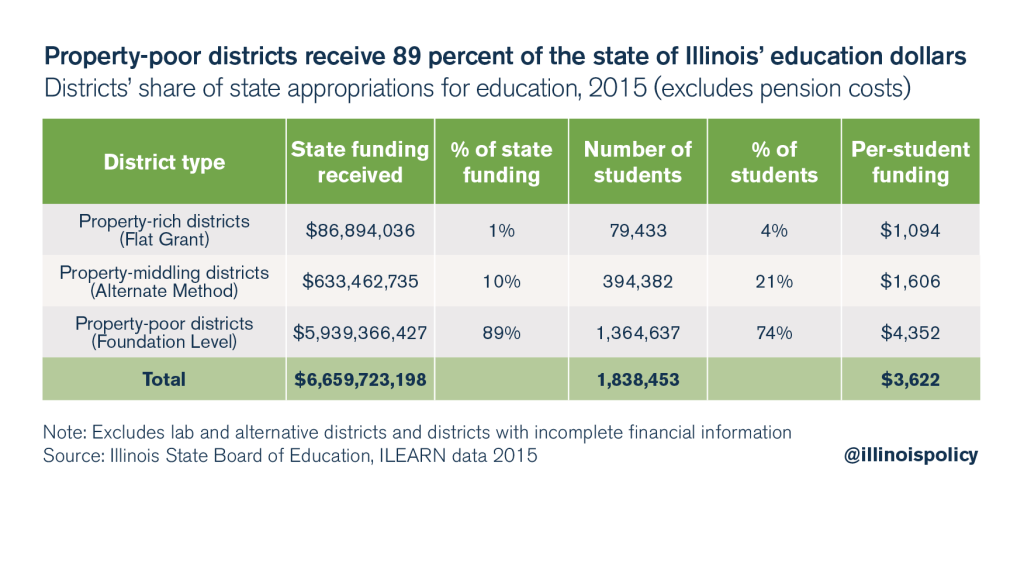
In total, Illinois’ property-poor districts – known as Foundation Level districts – received nearly 90 percent of the $6.7 billion state government spent on education. (See Appendix for more information on district classifications under the state’s funding formula.)
In contrast, districts with the most amount of property wealth per student – known as the Flat Grant districts – received just 1 percent of the state’s $6.7 billion in aid.16
For an example of how state funding is distributed, take East St. Louis School District 189, one of the most property-poor districts in the state. The district has limited ability to raise local funds through property taxes and therefore relies heavily on state funding.
The school district spends a total of $15,450 per student and relies on the state for 61 percent – or nearly $9,400 – of its spending per student. The federal government provides another 23 percent of the district’s spending.17
East St. Louis relies on local property taxes to provide just 16 percent of its per-student spending.
In contrast, the progressive nature of state aid results in little support to districts that can fund their education largely through their own local property tax base.
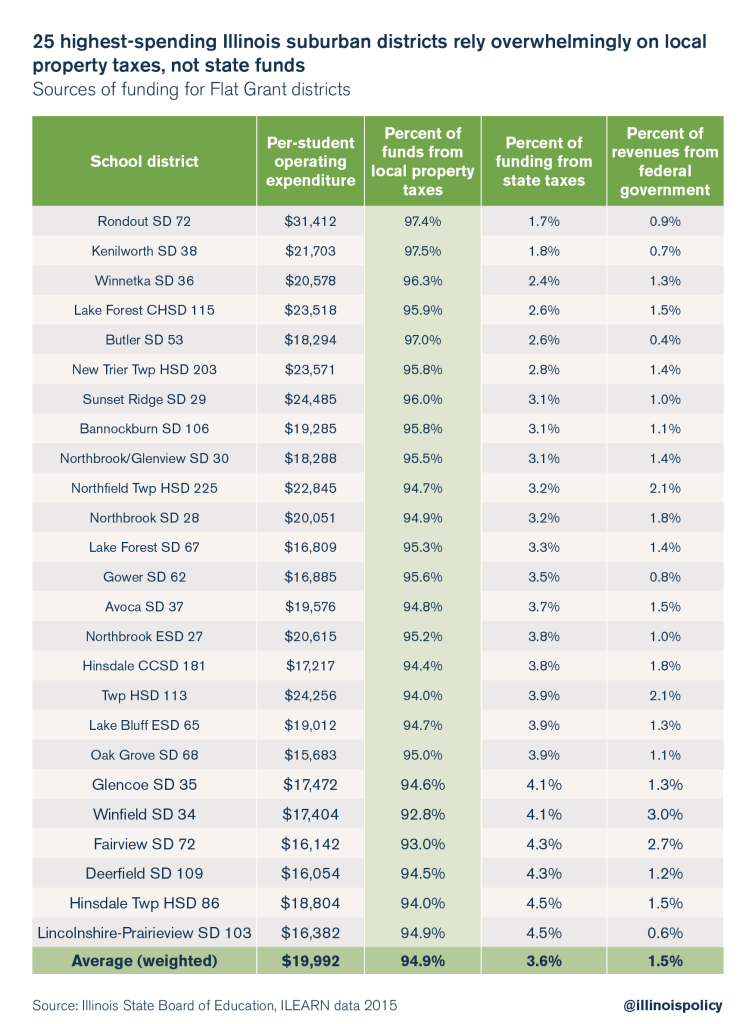
Take the elementary school district in Kenilworth, one of the wealthiest districts in the state. It spends $21,700 per student, but receives less than $400 per student in state support.18
Nearly $20,000, or more than 97 percent, is funded through local property taxes.
The above examples show how education funding works in Illinois. State-based funds flow largely to property- poor districts to compensate for their lack of property wealth. Property-wealthy districts pay for a majority of their own costs.
In fact, Illinois’ property-poor districts actually spend nearly $12,000 per student, more than the national average of all districts. In addition, Illinois’ poorest districts also outspend the average district in every neighboring state.19
The state provides property-poor districts with 45 percent of their revenue
Detractors from the state’s current funding formula like to point out just how little of Illinois’ total spending on education – including local, state and federal funds – comes directly from the state government.
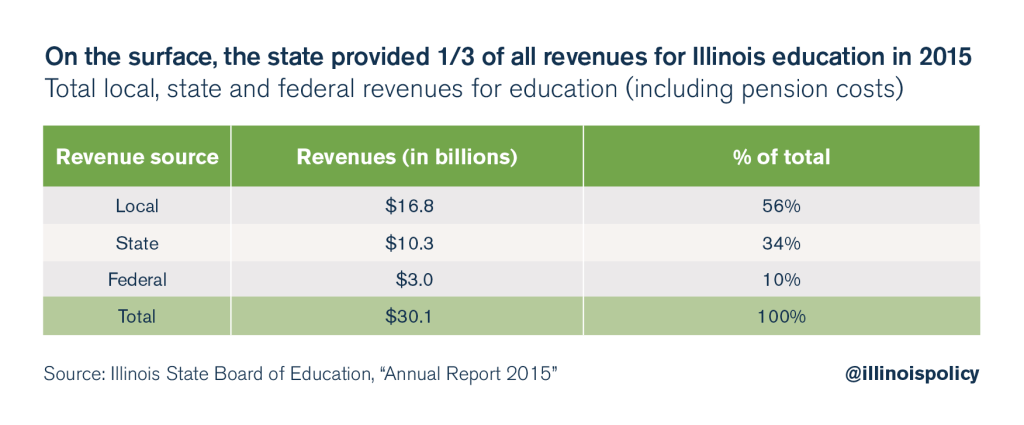
In total, across all sources, Illinois allocated over $30 billion for education in 2015.20
On the surface, the state provided $10.3 billion (which includes spending on teachers’ pensions) in education funds, a third of the aggregate dollars spent on education in Illinois.
However, the state’s share of total revenues cannot be equated with the average amount of support it provides to Illinois school districts.
A more accurate account of state support of education requires some adjustments to aggregate spending. Those adjustments include:
- Removing property-wealthy districts from the total. Since many of those schools rely very little on state funds, they skew the overall reliance on state funding lower.
- Reclassifying property replacement tax revenues as state revenues.
- Adding the contribution the state makes to the Teachers’ Retirement System’s, or TRS’s, portion of Illinois’ pension obligation bonds.21
- Adding the funding required for the state to pay the full cost – the Annual Required Contribution – of teachers’ pensions. Using a lower number underestimates the state’s true contribution toward education funding.
When those adjustments are made, the average Foundation Level district receives 45 percent of its funding from the state.
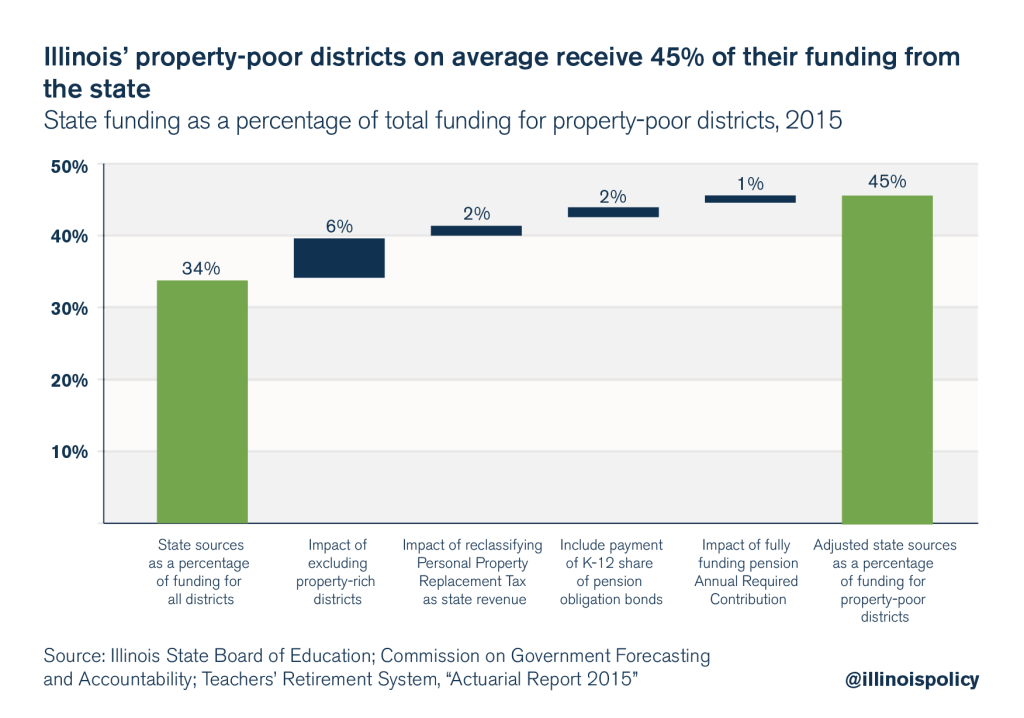
When the federal government’s contribution is included as well, it turns out that Illinois’ Foundation Level districts receive nearly 60 percent of their total funding from nonlocal sources.
Illinois’ wealthiest districts self-fund
The progressive nature of the state’s education funding formulas require the state’s most property-rich districts to fund themselves, ensuring that the overwhelming majority of state taxpayer funds go toward districts that demonstrate actual need.
Illinois’ 63 districts with the highest property wealth are classified as Flat Grant districts. This means that, because of their significant local property wealth, Flat Grant districts typically raise more than 90 percent of their total revenues for education through local property taxes.22
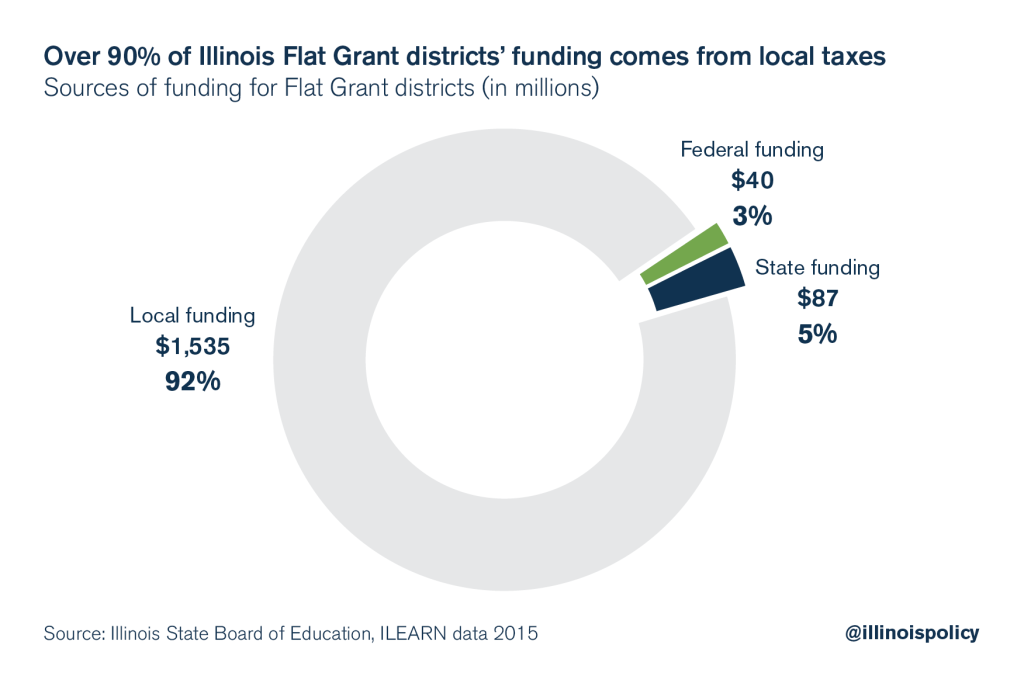
In fact, the 25 highest-spending suburban districts on average raise 92 percent of their funds locally. Just 3.6 percent of their funding comes from the state.23
By contrast, state districts with less available property wealth depend much more on the state.
Harvey School District 152 depends on the state for 67 percent of its revenues. Cicero School District 99 looks to the state for 64 percent of its education funding, and Aurora East School District 131 relies on the state for 60 percent of its revenues.24
Even Chicago, with its massive property wealth, relies on the state for nearly 35 percent of its education revenues. Only 50 percent of its revenues come from local property taxes.
Redistribution of property-wealthy district dollars won’t help
Some critics of the current system say it’s unfair that certain districts spend more on education than others. But that criticism also misses the broader point of Illinois’ funding formulas.
While it is true that a relatively small group of property-wealthy districts spend more per student than the average Illinois district, their spending is almost entirely locally funded.
That’s why in total Illinois’ property-wealthy districts receive just 1 percent, or $87 million, of the state’s $6.7 billion spent on education.
Even if critics’ advice were heeded, cutting per-student spending in the wealthiest districts and spreading that money throughout Illinois’ less wealthy districts wouldn’t dramatically change the per-student amount spent on education.
Even if total spending – including local, state and federal – per student in Illinois’ Flat Grant districts were cut in half, to $8,650 from $17,300 per student, and those funds redistributed to Foundation Level and Alternate districts, those districts would gain less than $400 per student. That’s hardly the solution to Illinois’ education problems.
Illinois’ education funding system is progressive
The common perception of Illinois’ wealthier school districts is that they consume state education dollars and thereby leave property-poor districts worse off.
But the opposite is true. Illinois’ education funding system is progressive in two ways.
First, as mentioned above, Illinois’ wealthy districts receive little state support. They are required to support their students through local property tax revenues.
Second, the residents in wealthy school districts pay for a disproportionate share of state aid to property-poor districts. Because the residents in wealthier districts tend to have higher-than-average incomes, they pay a disproportionate share of state income taxes. The state’s income taxes, in turn, are a major source of funding for state aid to education.
That can be seen in an Illinois heat map that captures the average income tax paid per return by ZIP code. The school districts that rely on state aid the least are located in ZIP codes where residents pay the highest income taxes.25
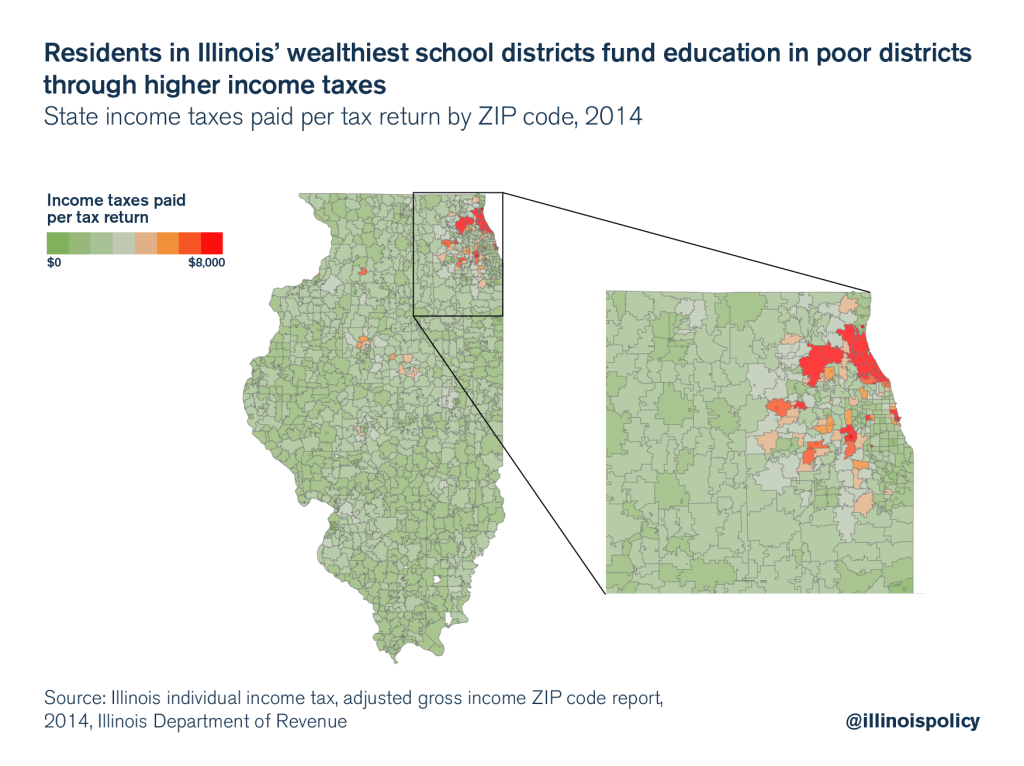
For example, the residents in the top 10 most property-rich districts pay almost 10 times more income taxes per tax return than residents in Illinois’ 10 most property-poor districts.
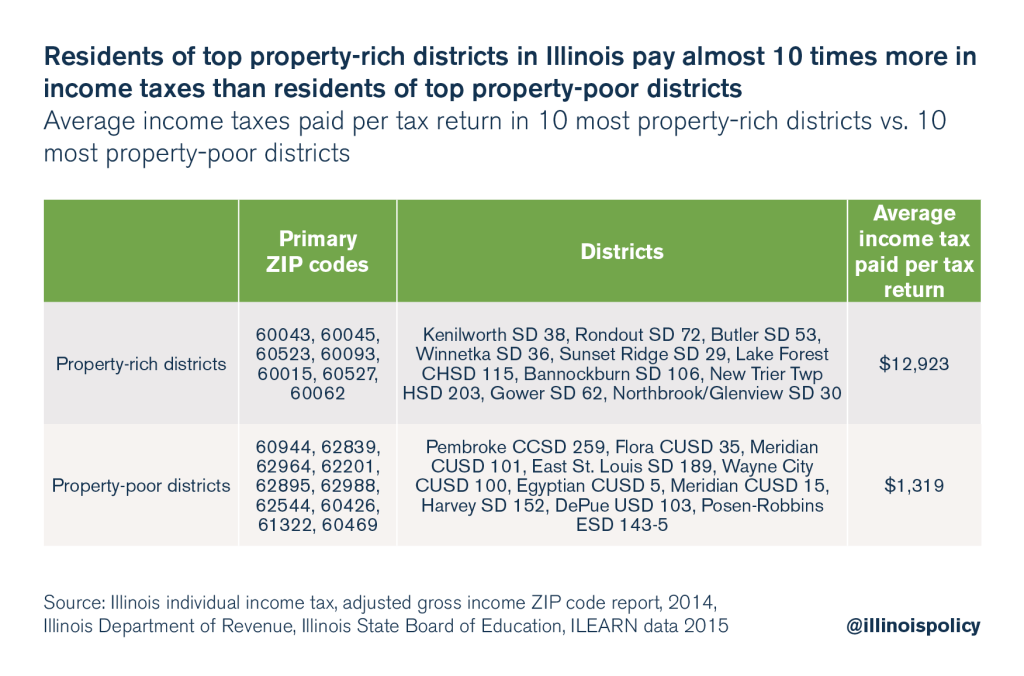
Not only do property-wealthy school districts largely self-fund, but their residents also shoulder a larger share of the state education funding spent in districts from East St. Louis to Harvey.
Poor students receive funding equivalent to that of wealthier students
Critics of Illinois’ funding formulas tend to focus most on their belief that the top quartile of students in poverty receive far less funding than students in the bottom, wealthier quartiles.26
But an examination of district spending patterns shows that simply isn’t true.
When Illinois’ school districts are broken down into quartiles on the basis of percentage of students in poverty (with each quartile containing roughly the same number of students), districts with the highest concentration of students in poverty spend more per student than districts with the lowest concentration of students in poverty.
The quartile with the highest concentration of poverty in Illinois spent nearly $14,720 in 2015, according to ISBE spending data.
In contrast, the quartile with the lowest level of poverty spent $12,660 per student, 16 percent less than the highest-poverty districts.
Illinois’ funding of education has many problems that should be fixed, but the funding formula that ensures state funding makes it to the most needy children in the state’s property-poorest districts is not one of them.27
If critics of Illinois’ education system are looking for more funding to reach Illinois’ students, then reforming the real problems driving the crisis in education – spending on pensions, district administrative costs and a general lack of accountability – is essential. Due to the progressive nature of the state’s funding formulas, Illinois’ poorest students would benefit the most from the money saved due to these reforms.
What’s really wrong with education finance in Illinois: Pensions and administrative compensation
The problem with education finance in Illinois isn’t the state’s funding formula and how it distributes education funds. In general, the formula works as intended, with poorer districts receiving the vast majority of the state’s support.
Nor is the problem an overall lack of funds. The amount Illinois spends on education has grown steadily over the past few decades, with Illinois now spending the most per student in the Midwest.
However, increasing the amount spent on education has not guaranteed that more money has been spent on teaching children.
That’s because state education spending is made up of much more than what is spent daily to run Illinois schools. Billions of dollars are spent annually on teacher pensions and district administrators’ compensation, siphoning funds from Illinois’ classrooms.
Education funding cannot be reformed without resolving Illinois’ pension crisis and reducing the state’s teacher retirement costs. Pensions are consuming billions of dollars and crowding out state funding for classrooms and new programs. In 2015, nearly half of the state-level spending on downstate and suburban districts went toward retirement costs.
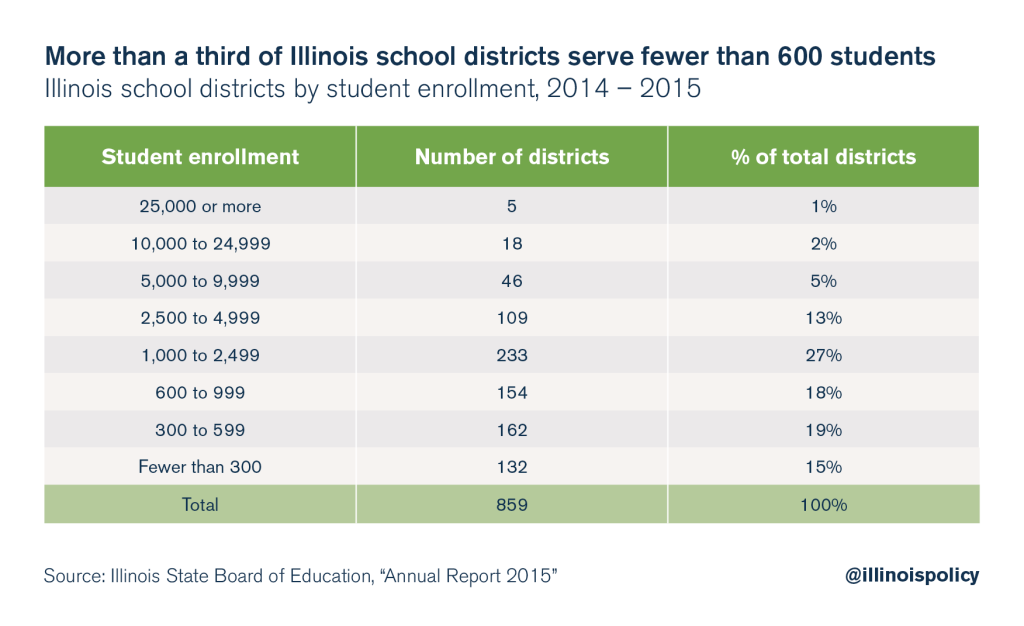
Illinois also needs to dramatically reduce the amount of bureaucracy in education. That reduction starts with the consolidation of Illinois’ 859 school districts – the fifth-most in the nation.
Illinois’ unfair pension costs
Proponents of funding formula changes are focused on fairness. But these activists say nothing about the most unfair spending in education – pension contributions to the teachers’ retirement fund diverting billions of dollars that could go to children and the classroom.
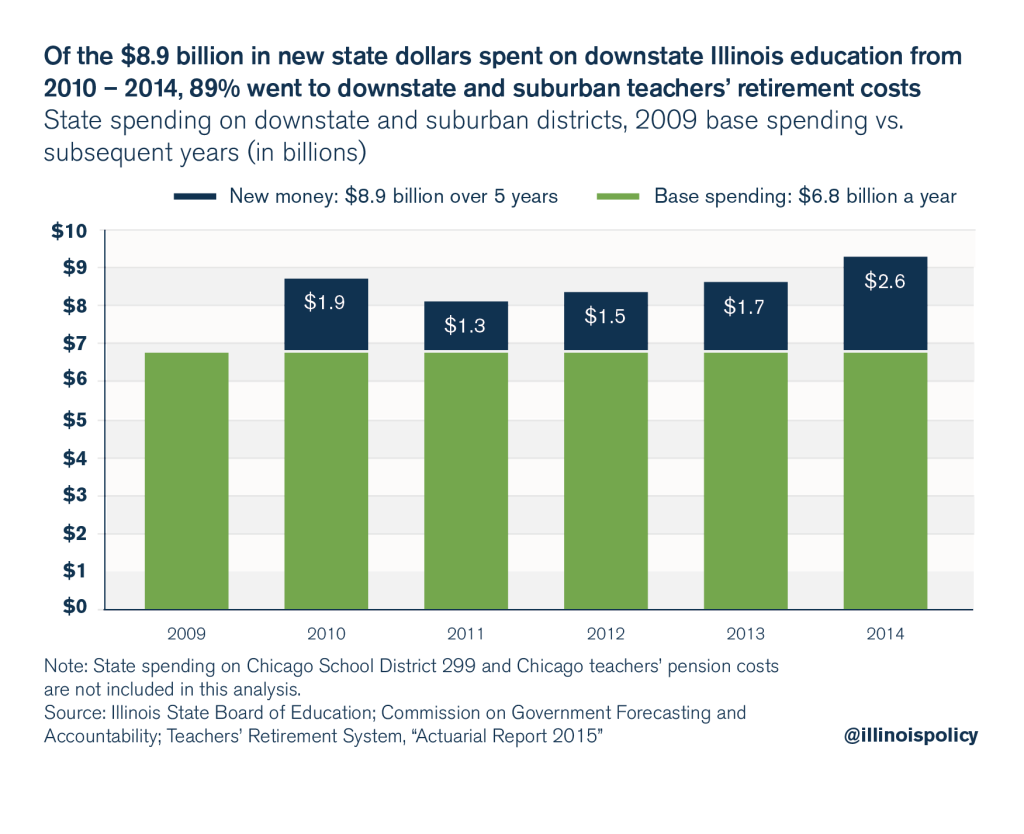
Pension costs are changing the education funding landscape. That change is best captured by how downstate and suburban teachers’ retirement costs overwhelmed state funding from 2009 to 2014. (Chicago is not included, as Chicago Public Schools – not the state – pays for its teachers’ pension costs.) Over that period, the state added $8.9 billion in new funds over and above the base amount of the $6.8 billion it spent in 2009. Of those new $8.9 billion spent, 89 percent went to retirement costs. Just 11 percent went to classroom costs.28
 If educators and policymakers really want to ensure children receive more money for everyday education, then pensions have to be addressed. Today, nearly one-half of the $9.5 billion the state appropriates to downstate and suburban districts goes to retirement costs.29
 State pension contributions are regressive
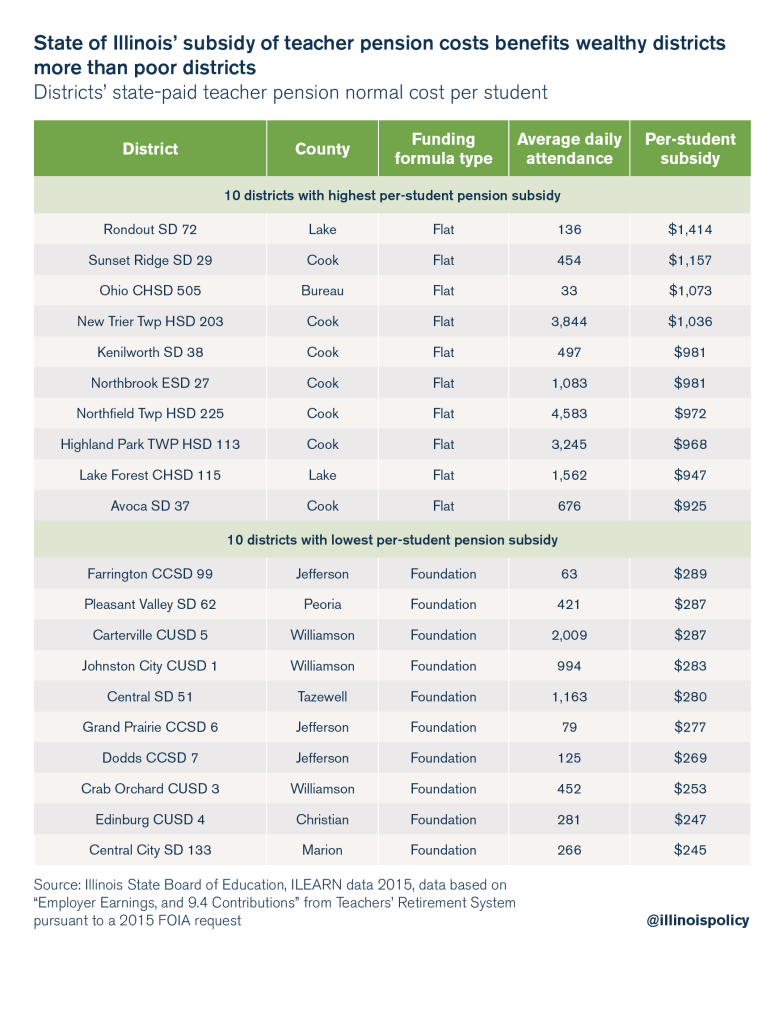
State contributions to teachers’ pensions are a regressive portion of the education funding system – the wealthiest districts actually benefit far more than poor districts do.
Currently, the state – not individual school districts – is responsible for paying the employer portion of teachers’ pension costs.
Teachers in the wealthiest districts tend to have higher salaries, and therefore higher pensions. So when the state makes contributions toward the pension funds on behalf of each district, it’s the wealthiest districts that benefit the most from not having to pay the cost of their teachers’ pensions.30
As a result, state taxpayer funding for pensions ends up favoring the districts in Illinois that require the least support. An Illinois Policy Institute study showed that wealthy districts, such as New Trier Township High School District 203, received over $1,000 per student in pension subsidies, while poor districts, such as Edinburg Community Unit School District 4, received less than $250 per student.31
Accrued benefits created the pension crisis
Many critics will be quick to blame the increase in state pension contributions on politicians’ underfunding of the pension system, but the bigger issue facing pensions – and why they eat up so much of education funding – is the decadeslong growth in teacher pension liabilities.
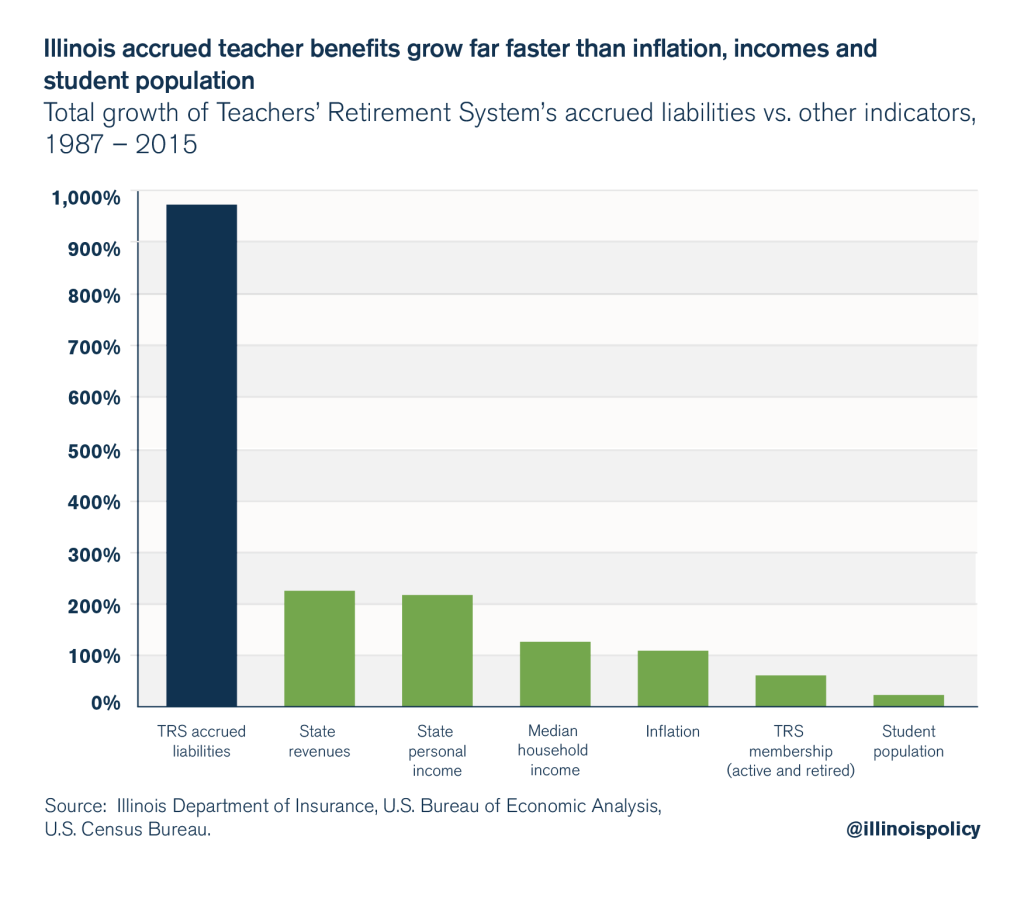
Accrued teacher pension liabilities – not unfunded liabilities, but the total benefits teachers have earned – have grown at a rate of 9 percent a year since 1987.32
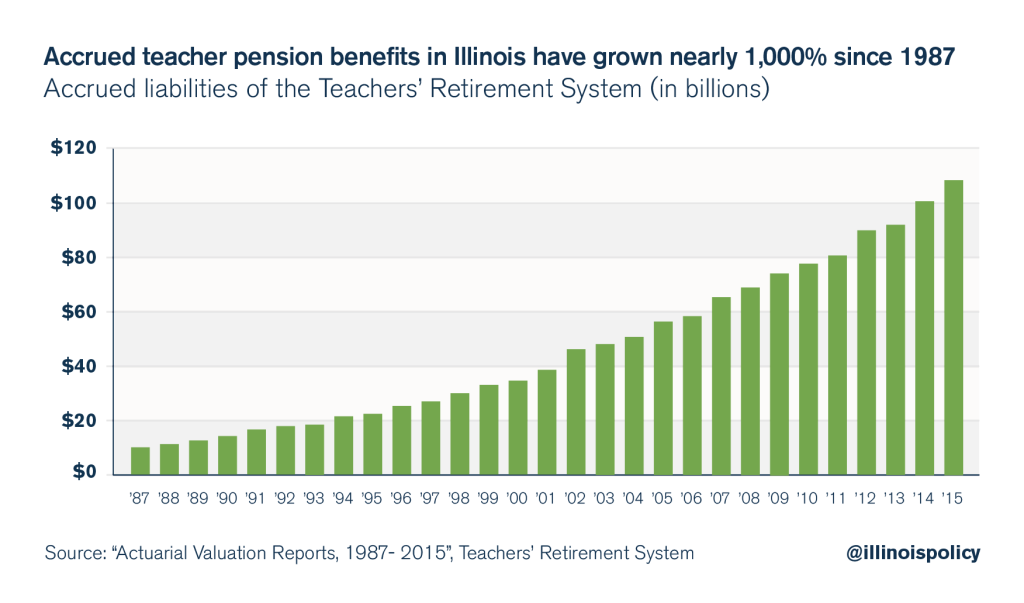
That growth rate far surpasses the growth rates of state revenues, inflation, household incomes and taxpayers’ ability to pay for those benefits during that same period.33
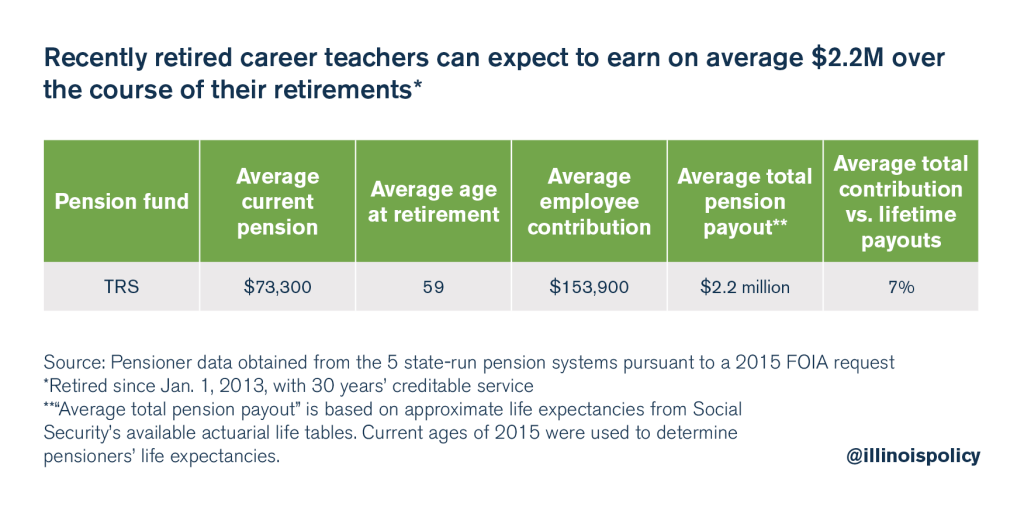
Teachers’ promised pension benefits have skyrocketed because of the generous retirement rules lawmakers have granted them over the years, including the fact that:34
- Nearly 70 percent of retired teachers began drawing (near full) pension benefits while still in their 50s.
- Teachers receive automatic 3 percent compounded cost-of-living adjustments to their pensions year after year after age 61 – which double retirees’ annual benefits after just 25 years.
- Teachers’ annual pension payments are not based on what they actually contribute to their own retirements, but on their final, and often spiked, salaries.
As a consequence of these rules, the average recently retired career teacher now receives $73,300 in annual pension benefits. In all, that teacher will collect $2.2 million in total benefits during retirement, having only contributed 7 percent of that amount over his or her career.35
The bottom line is that there will never be enough money for classrooms as long as the legislature allows pensions to overwhelm the state’s education dollars.
As long as teachers can retire in their 50s, collect annual cost-of-living adjustments that double their pensions over their retirements, and contribute little to their retirements, pensions will crowd out spending for children in the classroom.
Too many districts and too many administrators drain classroom funds
The growing cost of teacher pensions also plays a prominent role in education’s other big problem: too many school districts.
Illinois has 859 school districts – the fifth-most in the nation – many of which are overlapping and unnecessary, providing little value but costing taxpayers millions annually in administrative compensation.
Those costs include hundreds of millions in operating costs and billions more in pension costs that could be spent in the classroom instead.
On average, Illinois school districts serve just 2,399 students per district, the fifth-lowest among states with school populations over 1 million. Conversely, California school districts average 6,067 students.
If Illinois school districts served the same number of students as California, Illinois would have 500 fewer school districts than it has today.36
Nearly 25 percent of Illinois school districts serve just one school, and over one-third of all school districts have fewer than 600 students. An additional layer of administration for these districts is inefficient.37
The growth in school district administrators
Not only do taxpayers fund the principals, administrators, teachers and buildings at the school level, but they also pay for an additional layer of administration at the school district level.
Nearly all districts have superintendents and secretaries, as well as additional personnel in human resources, special education, facilities management, business management and technology. Many districts retain at least one assistant superintendent as well.
The number of school district administrators in Illinois has grown far faster than the number of students and parents they are employed to serve. Between 1992 and 2009, the number of district administrators grew by 36 percent in Illinois, 2.5 times as fast as the 14 percent growth in students. If the number of administrators had simply grown at the same rate as students, Illinois would have nearly 19,000 fewer administrators and would be spending $750 million less in compensation annually.38
Today, there are over 9,000 school administrators in Illinois – from principals to superintendents – making six-figure salaries, and each of these administrators will receive $3 million or more in pension benefits over the course of retirement.39
Case study: New Trier
A clear example of the potential to dramatically reduce administrative operating and pension costs through consolidation can be found in New Trier Township High School District 203.
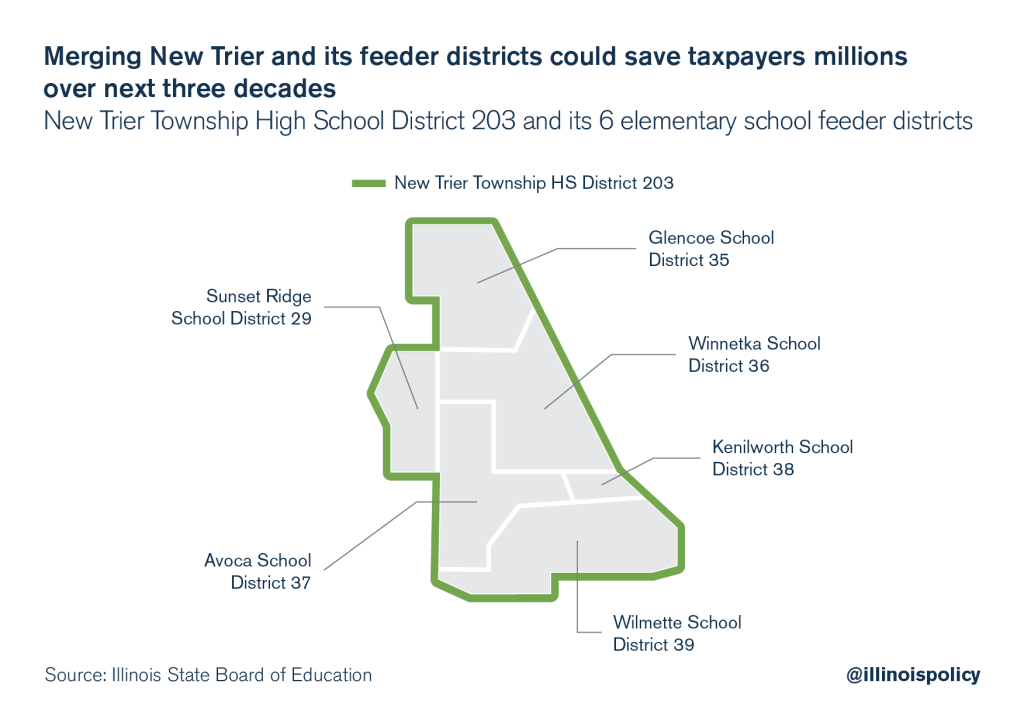
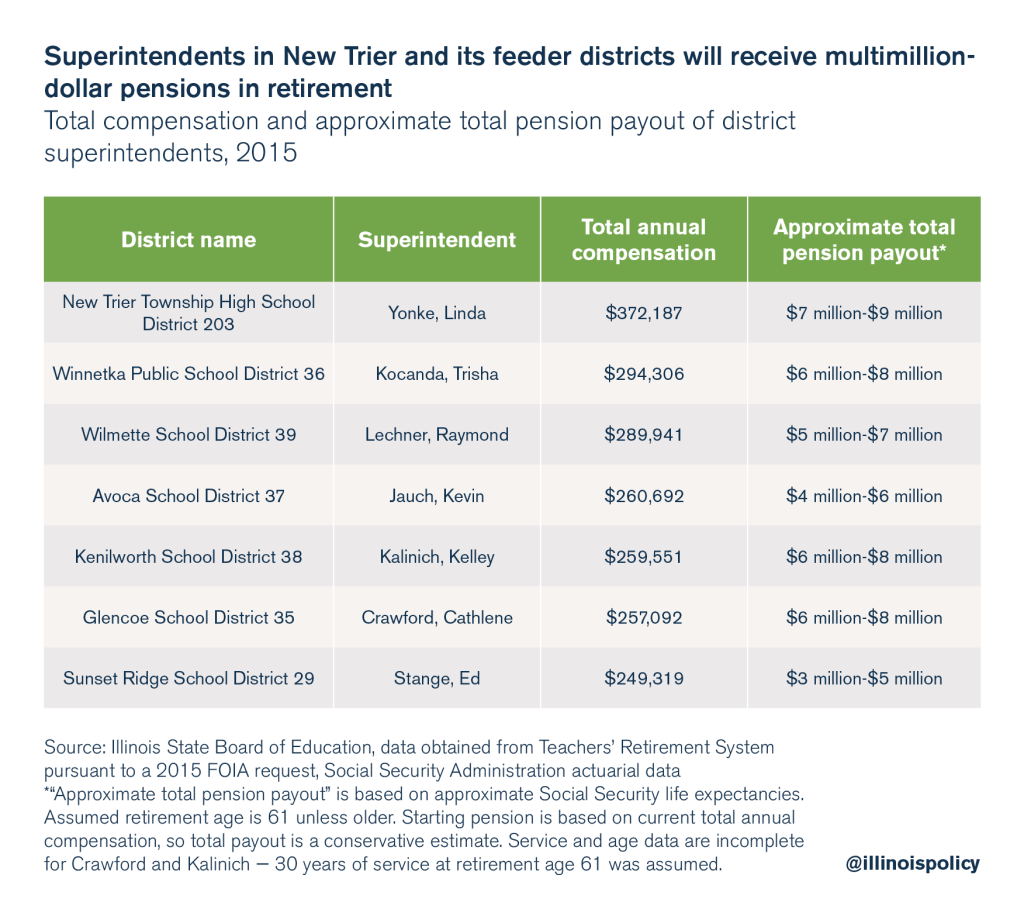
In the New Trier area, six different K-8 school districts feed into a single high school district. Taxpayers are required to pay for seven different superintendents, whose average total compensation ranges from $250,000 to $375,000 per superintendent.40
If the area’s elementary districts were combined with the high school district, New Trier could reduce the number of superintendents down to one, from the current seven. That would save local taxpayers millions of dollars a year, just from the reduction in superintendent compensation.
But reducing the number of duplicative superintendents is only a start. A large number of the seven districts’ 136 total administrative staff could be eliminated if the seven districts consolidated. In all, New Trier-area taxpayers could save millions in salary costs annually if the number of administrative staff were cut in half through consolidation.
In addition, because the state pays the pension costs of K-12 educators in TRS, taxpayers from Effingham to Carbondale to Quincy are chipping in for New Trier district staff and administrative pensions.
By consolidating just its superintendents, New Trier could save state taxpayers $30 million in pension costs over the next three decades.
Such potential savings are not unique to New Trier. Consolidation of small districts (not of schools themselves) and of districts coterminous with each other could save taxpayers hundreds of millions a year in administrative costs and billions more in pension costs, which could be funneled back into funding for Illinois’ classrooms.
Solutions
Most critics’ proposed solutions will not solve Illinois’ education problems. Simply pouring billions of additional dollars into education will only encourage more political fighting over who controls the flow of state aid. And it won’t change how effectively or responsibly those dollars are spent on students’ education.
To truly change the education system in Illinois, lawmakers must do the following:
1. Enact comprehensive pension reform
Currently, the state pays the employer contribution of teachers’ pensions on behalf of school districts. In doing so, the state is essentially paying for school district spending decisions on salaries and pension-boosting perks over which the state has no control.
School districts should be held accountable and responsible for the total cost of compensation for their employees, just like every other local government in Illinois. The responsibility for paying the employer contribution for teachers should be shifted back where it belongs – to local school districts.
While the state will continue to pay down the unfunded pension debt for teachers’ and state universities’ employees’ funds, local school districts and universities should pay the annual pension costs their employees accrue moving forward.41
In addition to enacting a pension cost shift, lawmakers should move away from the state’s broken pension funds. Illinois should follow the example of nearly 85 percent of private-sector companies and of states ranging from Washington to Rhode Island that have initiated some form of self-managed plan for their workers.42
New teachers should be given self-managed retirement plans, and optional self-managed plans should be offered to current teachers.
2. Encourage consolidation across Illinois’ 859 school districts
Illinois law makes it difficult to successfully pursue consolidation efforts. And consolidating school districts comes with unique challenges – it is the one type of local government that local residents are generally unwilling to change. Serious consolidation of the state’s 859 school districts will only happen when the state partners with local districts to provide a cooperative solution.
To that end, the Illinois General Assembly should authorize the creation of an official District Consolidation Commission, which would function in a manner similar to the federal government’s Defense Base Closure and Realignment Commission. The commission’s consolidation recommendations – of school district administrations, not of schools – would be approved by an up or down vote, meaning no amendments would be permitted, in the General Assembly.43
Illinois could experience school district operating savings of hundreds of millions annually and could conservatively save several billion dollars in pension costs over the next 30 years by cutting the number of school districts in half.
3. Increase accountability
While the above reforms are important, none of them will change outcomes or directly encourage innovation in education.
The best way to improve outcomes is to create more accountability in the education system. Illinois must enact reforms to empower parents to make the right choices for their children and to be able to hold their local districts accountable for poor performance and inefficient spending.
Those reforms include offering families and children more educational options and access to a variety of school types, whether public or private, big or small.
Today, only families with financial means can afford to choose schools that best meet the needs of their children, whether by sending them to private schools or by moving to a district in a different community. But parents without financial means don’t have those same options. Instead, they are forced to send their children to schools based on their ZIP codes, not their needs.
Fortunately, more than 25 states across the country, including Wisconsin and Indiana, are now finding ways to engage more families in the education of their children. These states offer parental choice in education in the form of school vouchers or educational savings accounts.44
Under these programs, parents – not bureaucrats – decide where their children go to school and how and what they learn.
Nevada, the most recent state to pass a school choice program, is offering education savings accounts to its 385,000 public school students.45
Nevada parents will soon have the right to access a variety of educational options: from private schools and online classes, to tutoring programs and other learning interventions. Those parents will have greater control over their children’s future, allowing them to match various educational offerings with their children’s individual needs and learning styles.
Illinois should follow Nevada, Indiana and Wisconsin’s lead and transform Illinois’ education system into one that delivers choice to parents and students and holds educators accountable.
Appendix: Understanding General State Aid
Not every district has the ability to pay for its own education expenses.
Districts such as East St. Louis School District 189, Cicero School District 99 and Joliet School District 86 are unable to raise enough property tax revenue to meet state-mandated education funding levels.
That’s where General State Aid, or GSA, steps in.
The goal of GSA, through the Formula Grant, is to ensure that every child in the state has access to a minimal level of education dollars.
To accomplish this goal, the state sets a minimum level of spending per student. This is called the Foundation Level. For fiscal year 2013, the Foundation Level was set at $6,119 per student.
The state distributes GSA funds according to each district’s ability to reach the Foundation Level. That ability is based on how much property value the district has within its borders and, at an assumed tax rate, how much it can generate in property tax revenues.
If a district, such as East St. Louis or Joliet, is not fully able to generate enough local property tax revenue per student to reach the $6,119 Foundation Level, the state makes up the difference on a per-pupil basis.
The state also provides limited GSA funds even for districts that can raise more than $6,119 locally. To determine how much each district receives, the state has separated districts into three distinct categories:
1. Foundation districts – Foundation formula districts are those that cannot raise enough local property tax revenue per student to reach the Foundation Level.
These districts receive GSA funding to make up the difference between what the state assumes they can raise and the Foundation Level.
East St. Louis School District 189 is an example of a Foundation district. It disproportionately depends on the state for its funding. Since the district was only able to raise $891 per student in local property tax revenue in fiscal year 2013, it receives the $5,228 difference per student in state funding.
2. Alternate districts – Alternate formula districts have available local tax revenue per student between 93 percent and 175 percent of the Foundation Level.
These districts receive significantly less state support than Foundation formula districts, between $305 and $428 per student.
3. Flat Grant districts – Flat Grant districts have available local tax revenue per student that is 175 percent or more of the Foundation Level.
These districts pay for their own education expenses almost exclusively through locally raised property tax revenues and receive $218 per student from GSA.
New Trier Township High School District 203 is an example of a Flat Grant district. It raises $14,716 in local property taxes per student, which is more than two times the Foundation Level. It receives $218 per student from the state.
Endnotes
1 Natasha Ushomirsky and David Williams, Funding Gaps 2015: Too Many States Still Spend Less on Educating Students Who Need the Most, (The Education Trust, March 2015).
2 John Klingner, “Illinois Is a High-Tax State,” Illinois Policy Institute, Summer 2016.
3 U.S. Census Bureau, 2014 Annual Survey of School System Finances, (2014).
4 James Meeks and Tony Smith, Annual Report 2015, (Illinois State Board of Education, 2015).
5 ILEARN data, scal year 2015, Illinois State Board of Education, 2015.
6 When adjustments to aggregate spending are made. This includes removing spending by self-funded wealthy districts, adding the state’s total annual required funding – the Annual Required Contribution – to teachers’ pensions, adding the state’s contribution to TRS’s portion of Illinois’ pension obligation bonds, and reclassifying property replacement tax revenues as state revenues.
7 ILEARN data, 2014-2015.
9 Ted Dabrowski and John Klingner, “Too Many Districts: Illinois School District Consolidation Provides Path to Efficiency, Lower Tax Burdens,” Illinois Policy Institute, Spring 2016.
10 U.S. Census Bureau, 2014 Annual Survey of School System Finances.
11 Meeks and Smith, Annual Report 2015.
12 Ibid.
13 Ushomirsky and Williams, Funding Gaps 2015.
14 ILEARN data, scal year 2015.
15 Ibid.
16 Ibid.
17 Ibid. Local, state and federal share of total district revenue used to determine share of operational expenditures.
18 Ibid.
19 U.S. Census Bureau, 2014 Annual Survey of School System Finances.
20 Meeks and Smith, Annual Report 2015.
21 Teachers’ Retirement System, Actuarial Valuation Report 2015, June 30, 2015 Actuarial Valuation of Pension Benefits, (January 7, 2016). Note: Using a more realistic discount rate for TRS’s pension calculations would increase the state’s share of education revenues even further.
22 ILEARN data, 2014-2015.
23 Ibid.
24 Ibid.
26 Ushomirsky and Williams, Funding Gaps 2015.
27 While the state’s funding formula works as intended, there are still improvements that can be made. Lawmakers should eliminate the special subsidies built into the formula that send hundreds of millions of dollars annually to school districts whose revenues are affected by local property tax caps and special economic zones. The money those districts receive through the Property Tax Extension Limitation Law subsidy and Tax Increment Financing subsidy are nothing more than annual multimillion-dollar subsidies that crowd out state education aid for property-poor districts. These subsidies defeat the whole purpose of the state providing needs-based education funding to districts across the state.
28 Ted Dabrowski and John Klingner, “Pensions vs. Schools,” Illinois Policy Institute, January 2016.
29 Ibid.
31 Ibid.
32 Illinois Department of Insurance.
33 Teachers’ Retirement System, Actuarial Valuation Reports 1987- 2015.
34 Based on member data received from TRS pursuant to a 2015 FOIA request.
35 A recently retired career teacher is de ned as having 30 years or more of service and having retired since Jan. 1, 2013.
36 Dabrowski and Klingner, “Too Many Districts.”
37 Dabrowski and Klingner, “Too Many Districts.”
38 Sca di, The School Staffing Surge.
39 ISBE salary database data received pursuant to a 2015 FOIA request.
40 District administrative compensation data received from school districts pursuant to a 2015 FOIA request.
41 Hitt, “Playing Favorites.”
43 Dabrowski and Klingner, “Too Many Districts.”
44 School choice programs compiled by EdChoice.