Illinois educators pay hundreds of dollars every year in dues to their unions.
The bulk of that money doesn’t stay with the local bargaining units. It flows up the chain to the state and national affiliates.
Teachers have a right to know how those affiliates are spending money. The best public sources for examining union spending are LM-2s, which are federal reports unions file annually with the U.S. Department of Labor.1
LM-2s provide information, in the union’s own words, about how the union spends money. These reports can be difficult to access or interpret.2
To assist teachers in evaluating the spending of the Illinois Education Association and the National Education Association, this report examines data pulled from the unions’ LM-2s on the following four areas of spending:
- Representational spending
- Spending on leadership
- Political spending
- Spending on affiliates
Illinois Education Association
The Illinois Education Association spent over $77 million in 2020.3
All members of local IEA bargaining units are also members of and send money to the state affiliate. As such, they have a right to know how IEA prioritized spending in 2020.
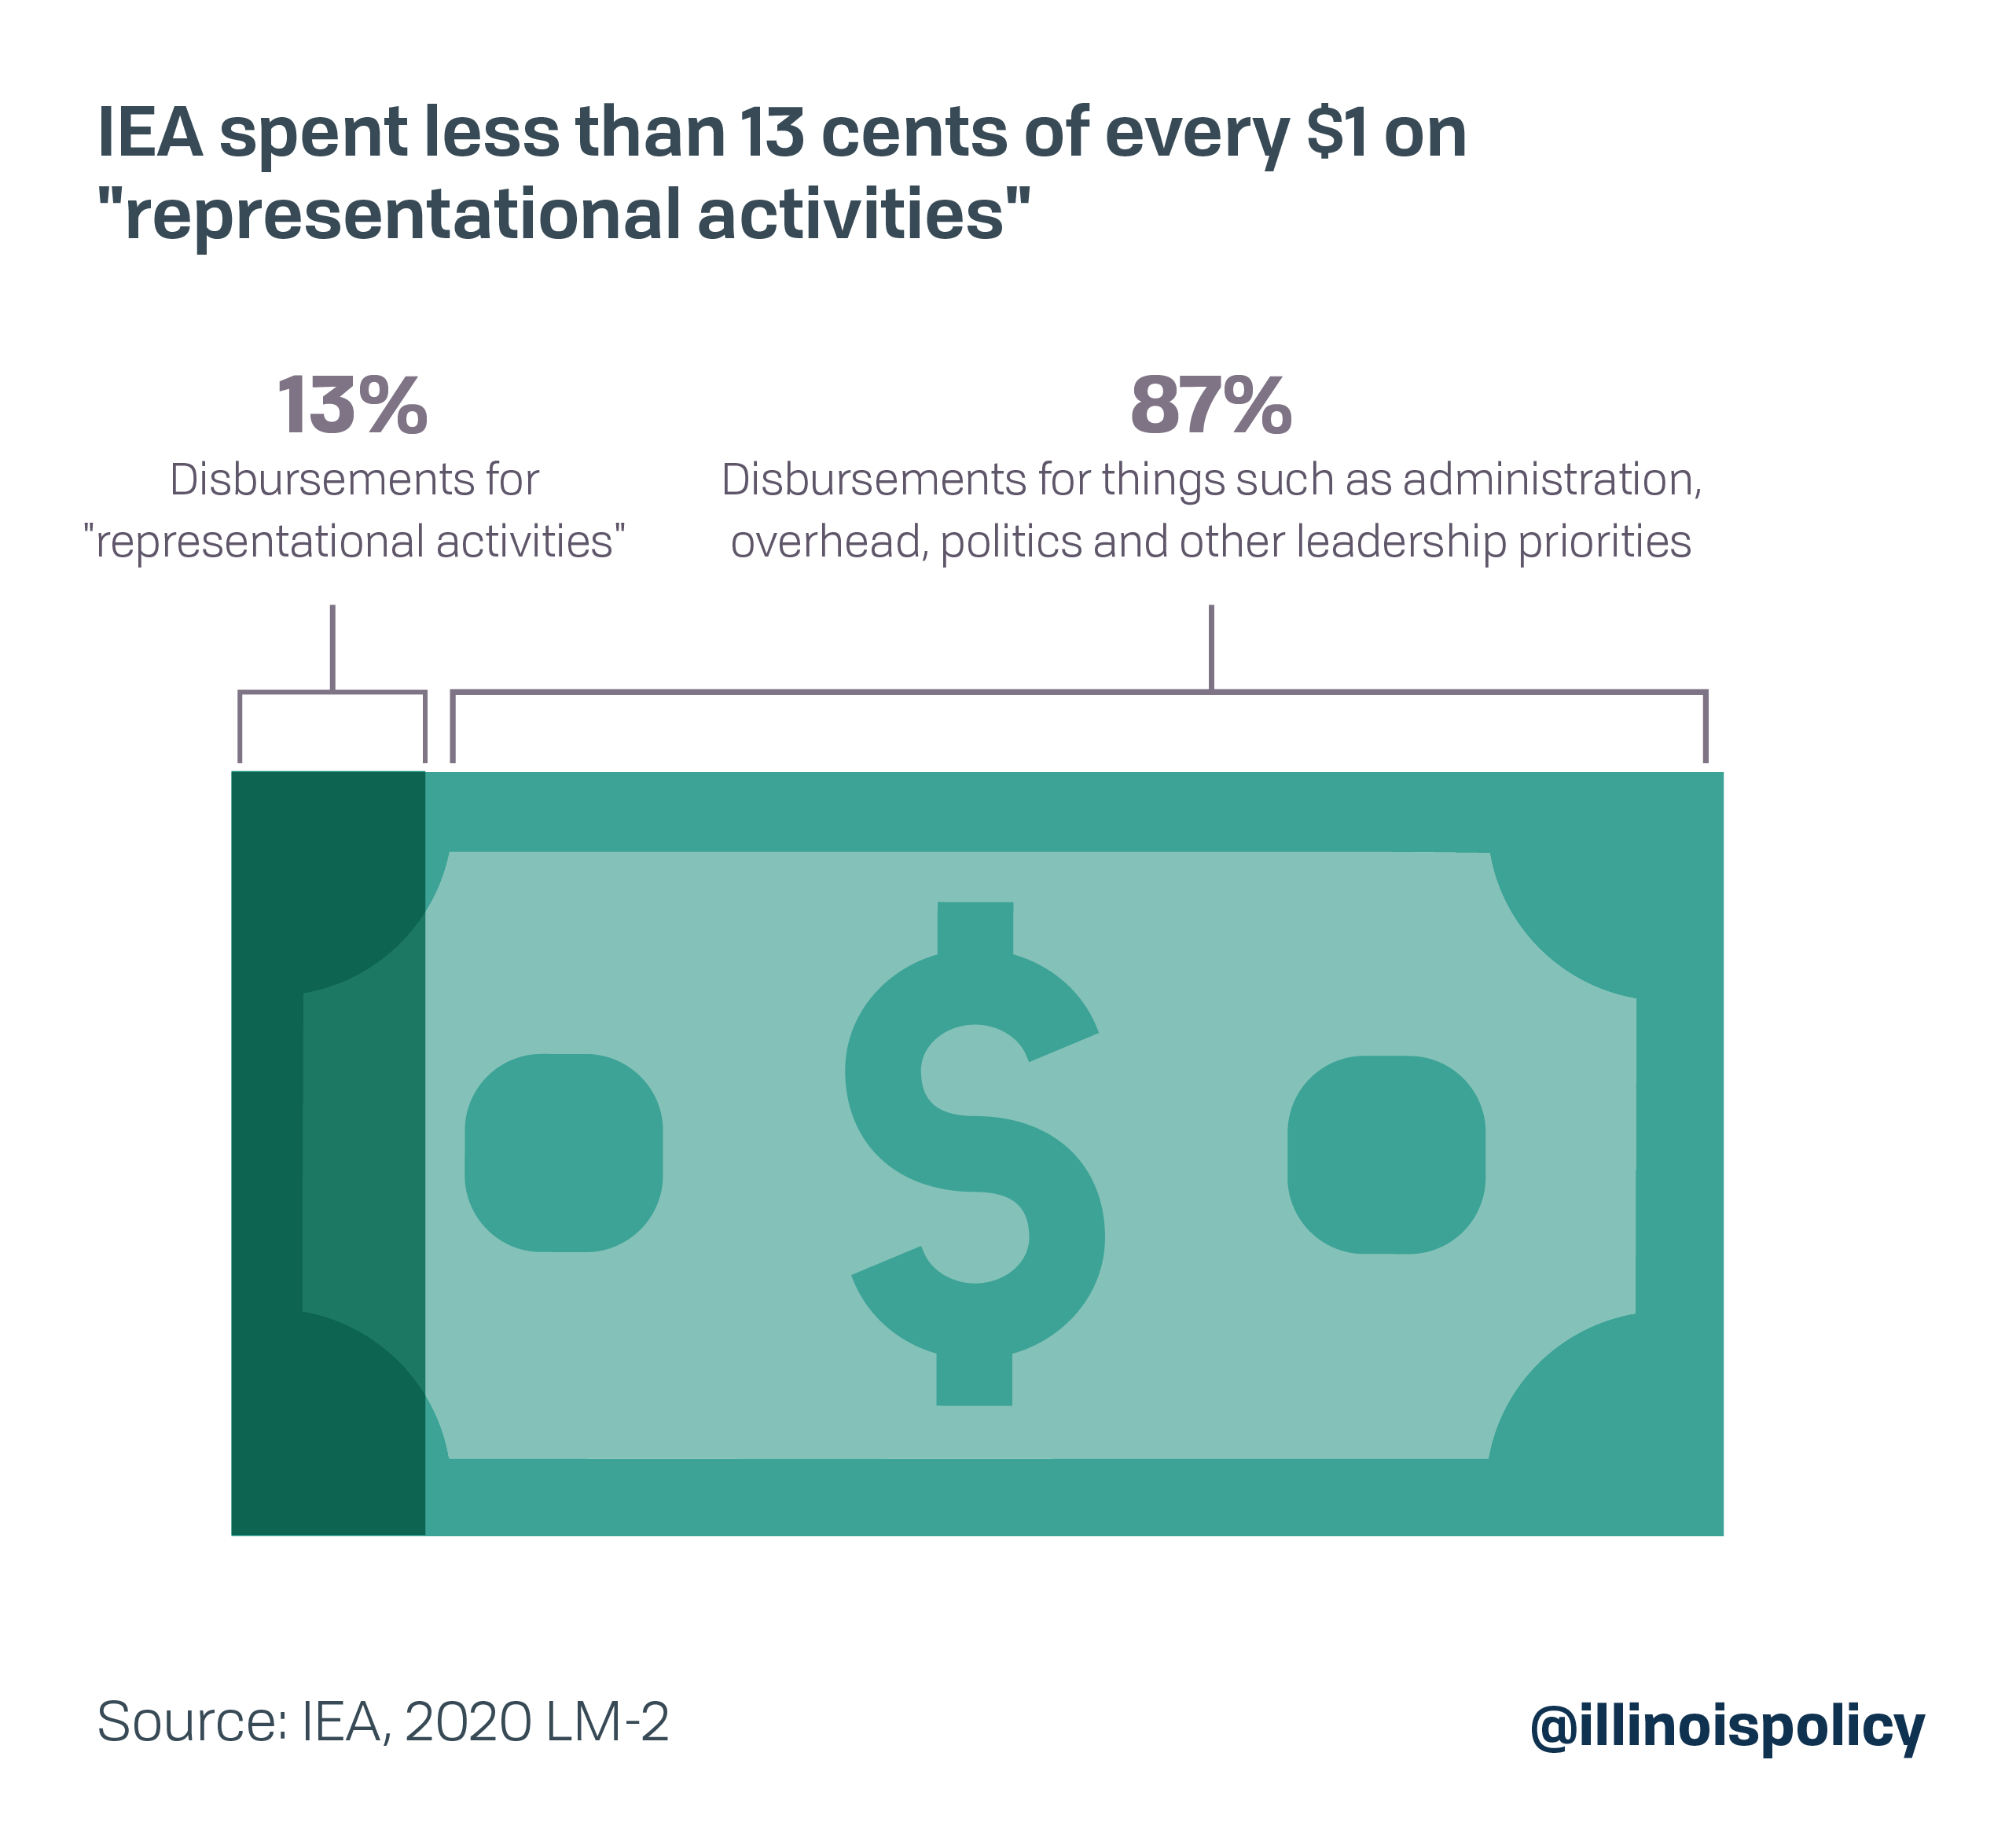
Representational spending: Less than 13% of IEA’s spending in 2020 was on representing members
IEA reported spending just $9,766,252 on “representational activities”4 – those activities related to negotiating collective bargaining agreements and the administration and enforcement of those agreements – in 2020.
That means less than 13% of IEA’s total spending was directed toward representing its members.
IEA spent the rest on administration, overhead, politics and other leadership priorities.
To place this in perspective, the Wise Giving Alliance, a project of the Better Business Bureau, maintains a nonprofit should spend at least 65% of its total expenses on program activities.6
While the Wise Giving Alliance tracks spending by charities, it stands to reason that IEA’s spending of less than 13% on representation – the purpose of a union – should be a cause for concern among members.
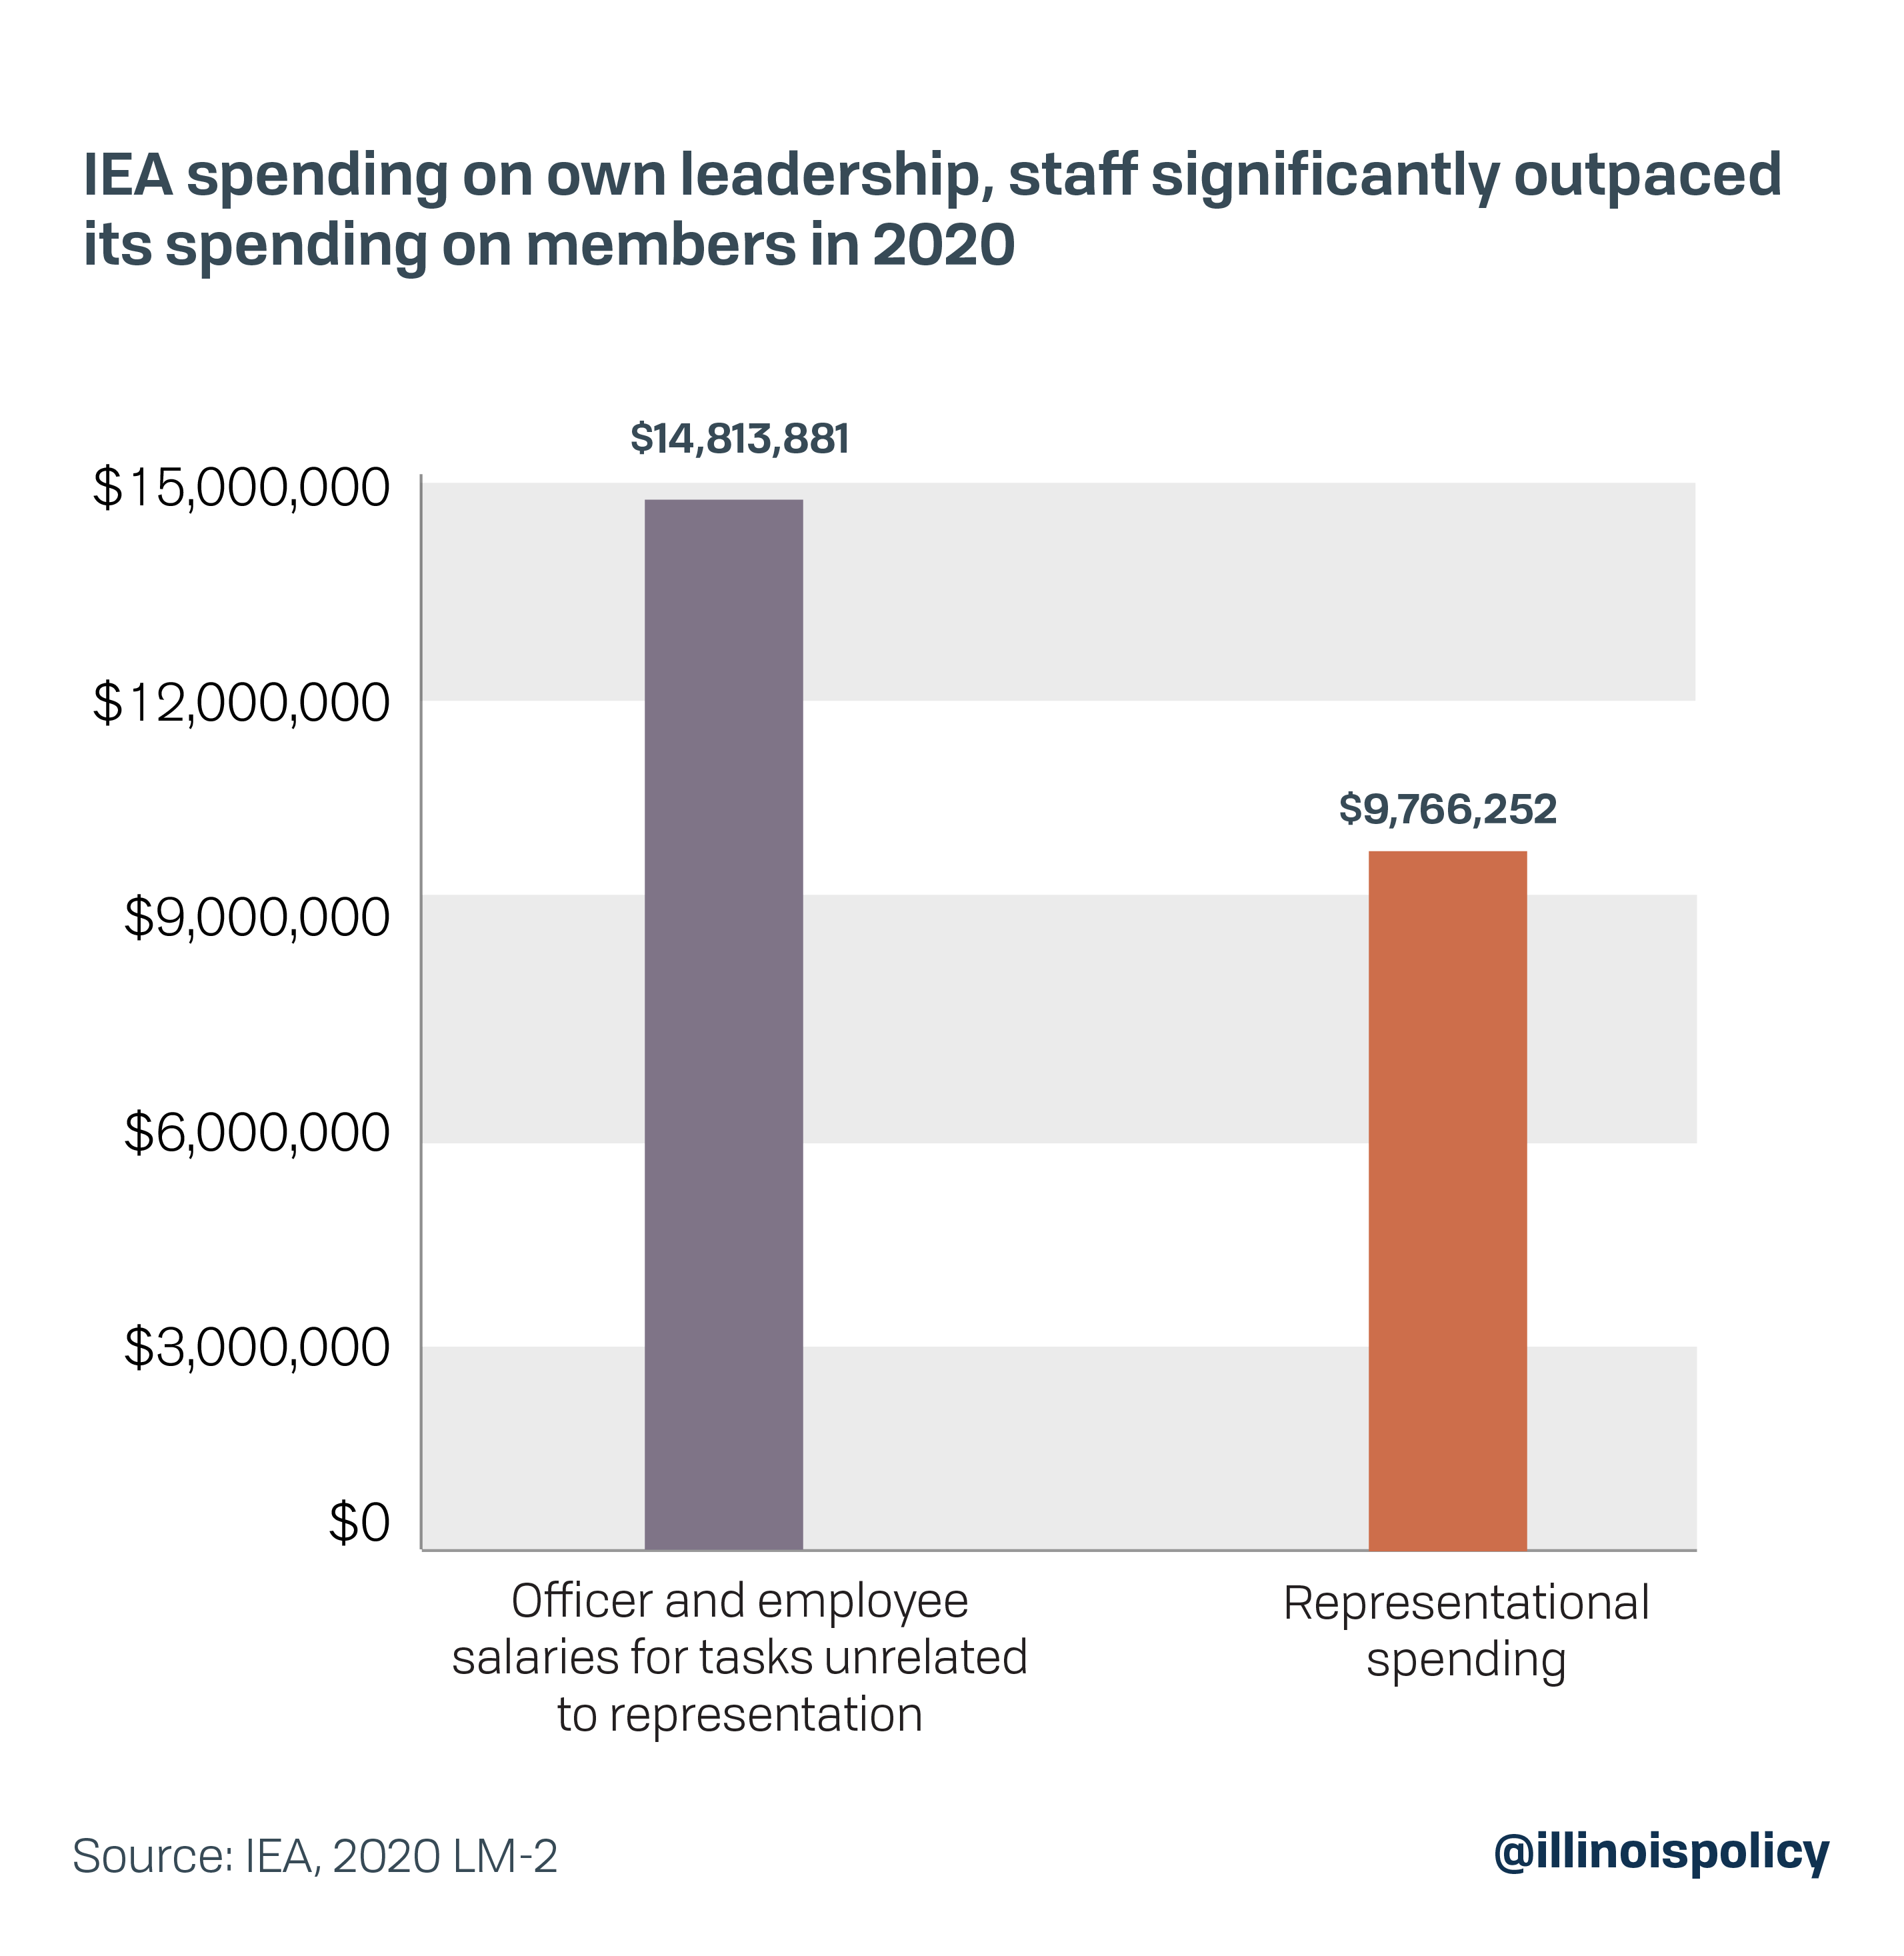
Spending on leadership: IEA spent nearly 52% more on its own leadership and employee salaries than on representing members
IEA reported spending $14,813,881 for officer and employee salaries for tasks unrelated to representational activities in 2020.7
That’s 52% more than its total spending on “representational activities.”
Political spending: IEA spent over $1.2 million on political activities and lobbying and other contributions
Many union members believe a longstanding myth that membership dues don’t fund politics, but IEA admitted spending over $1 million on political activities and lobbying in 2020.8
It also spent nearly $150,000 in contributions, gifts and grants, which can be political in nature.9
IEA’s disbursements to political causes are generally made without regard to whether its members support those causes.
Spending on affiliates: IEA spent more than 2.5 times more on Chicago-area affiliates than it did on affiliates south of Interstate 80
IEA represents educators throughout Illinois.
Yet the union clearly favors its affiliates in and around Chicago when it comes to funding.
IEA directed nearly $780,000 to affiliates in Chicago and Chicago suburbs in 2020.10 It directed less than $305,000 to its affiliates south of Interstate 80.11
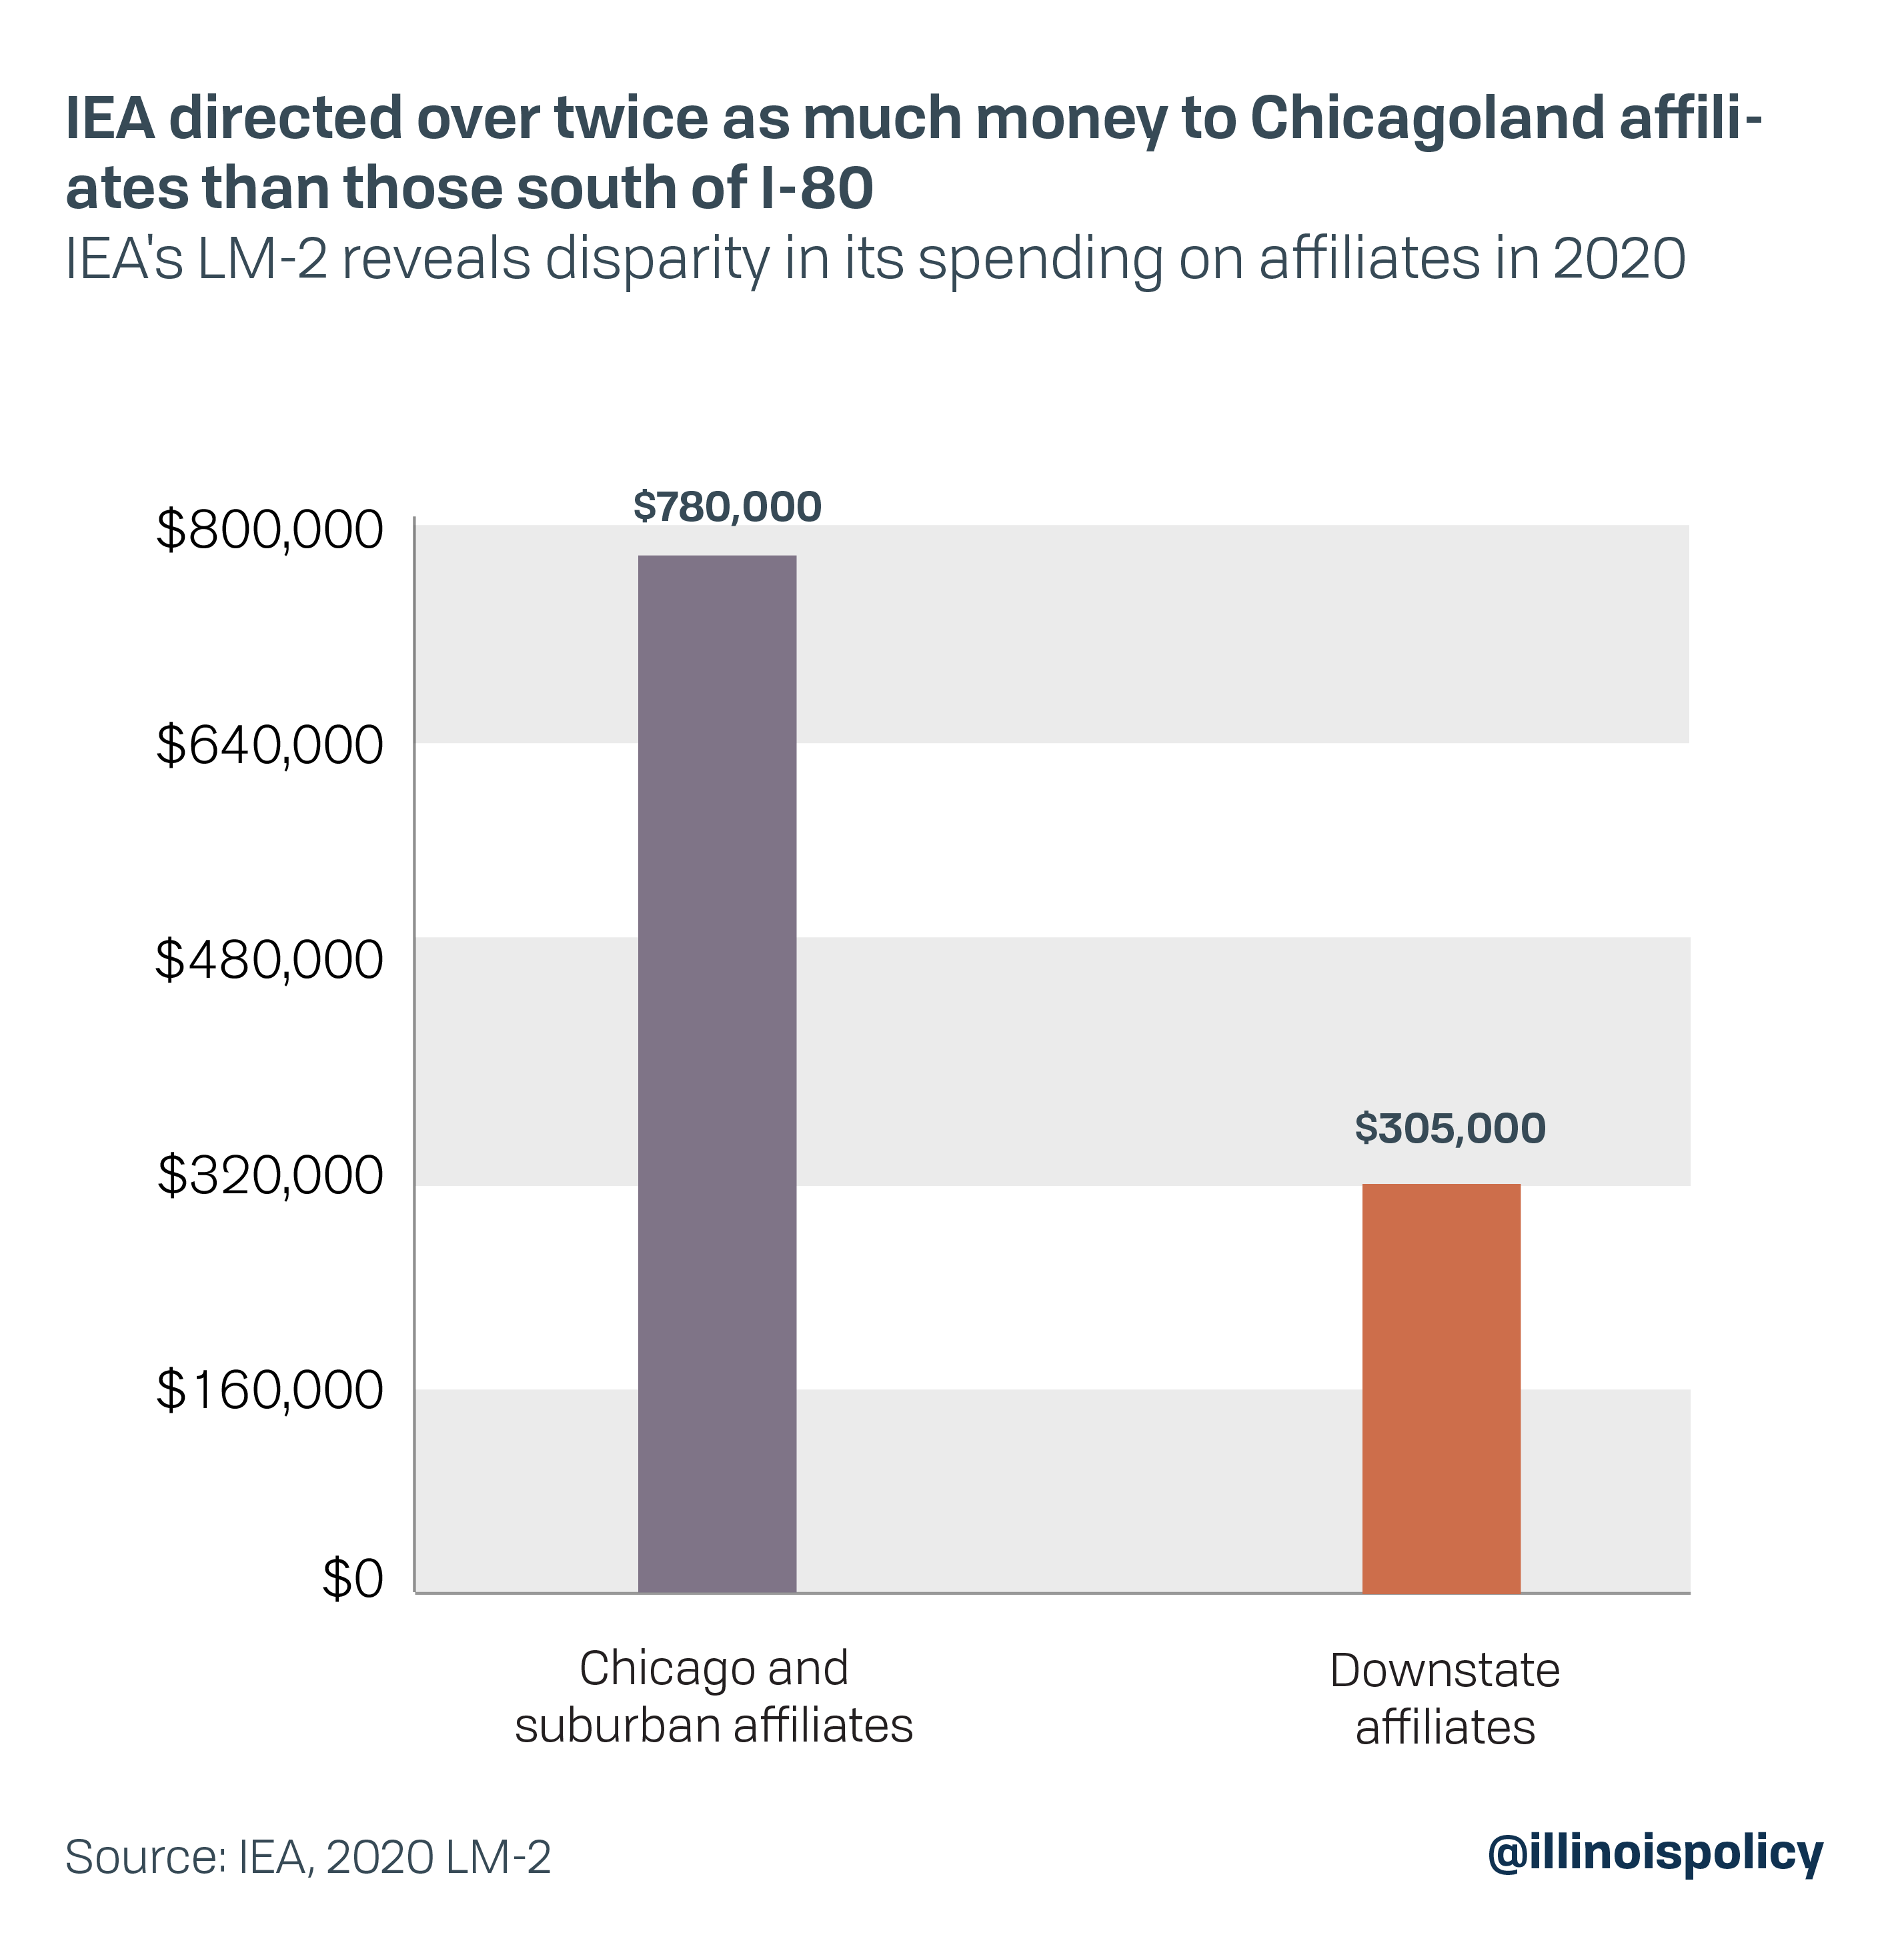
While educators in downstate Illinois sent thousands of dollars up the chain to IEA, they saw the majority of IEA’s affiliate spending flow to Chicagoland.
National Education Association
The National Education Association spent nearly $651 million in 2020.12
With the union spending nearly $1.8 million per day, its members have a right to know how the union prioritized that spending.
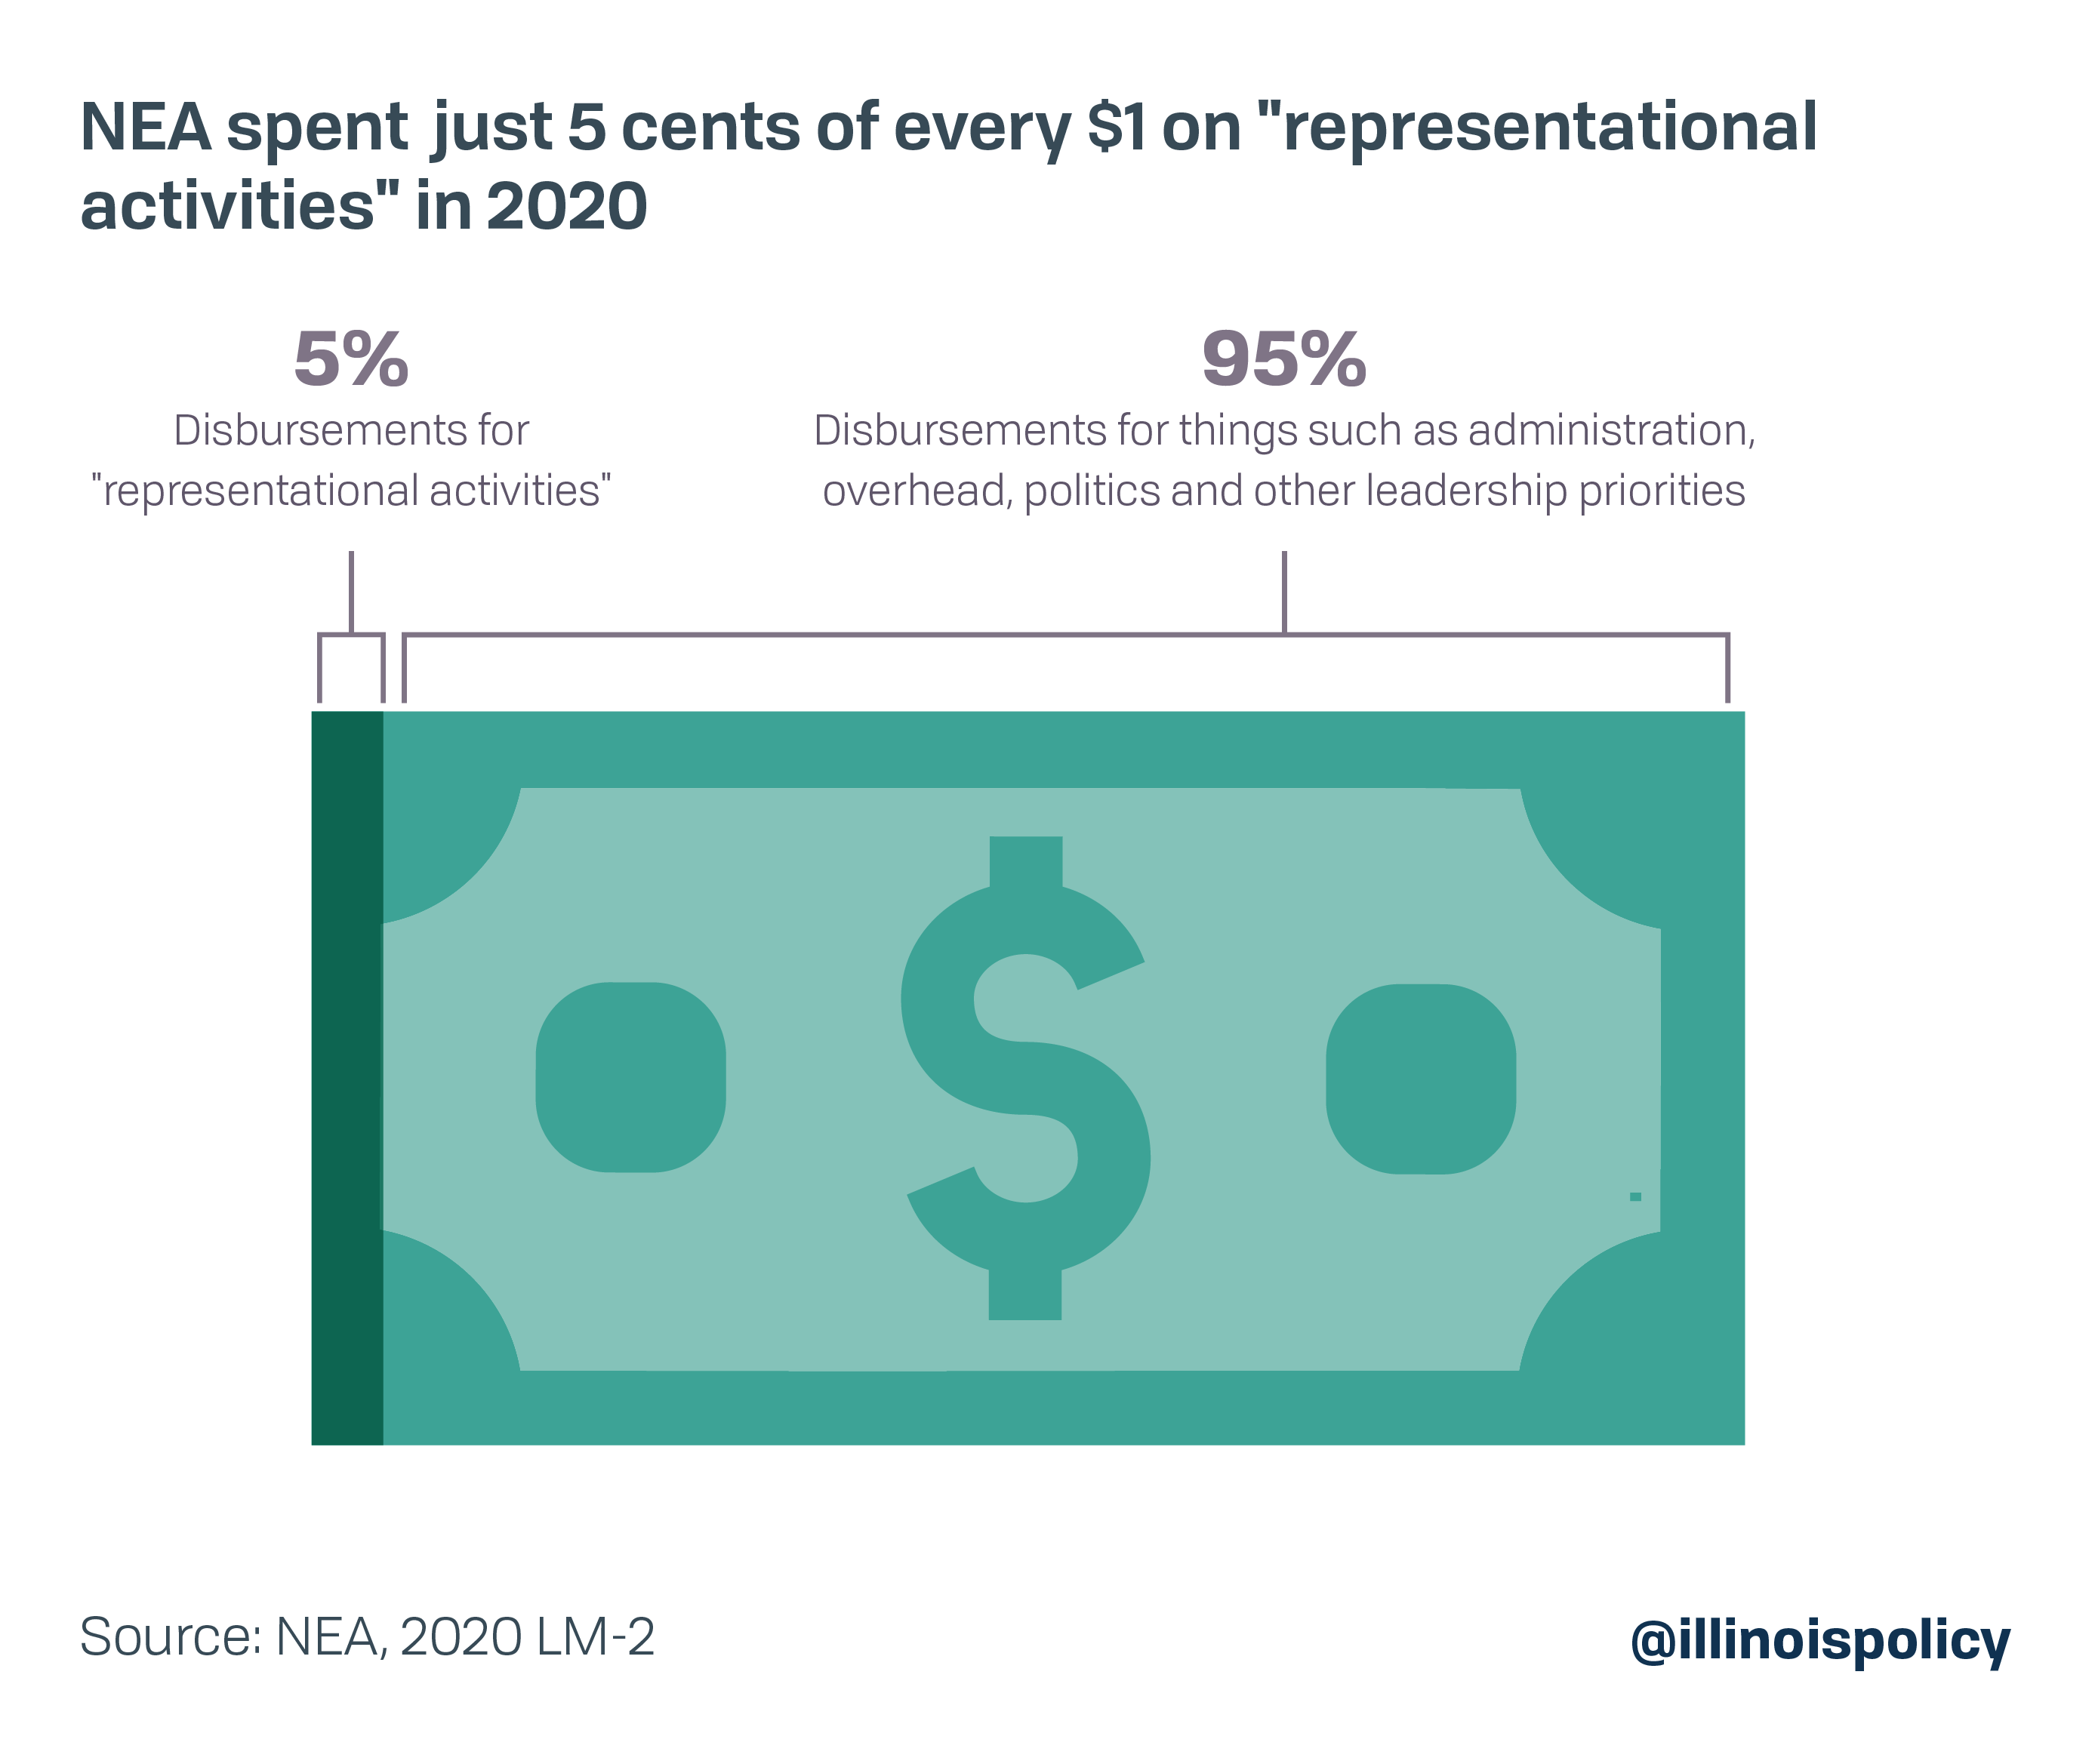
Representational spending: Only 5% of NEA’s spending in 2020 was on representing members
NEA reported it spent just $35,759,179 on representational activities – those activities supposed to be its core purpose – in 2020.13
That means just 5 cents of every dollar NEA spent in 2020 went toward activities supporting the representation of its members.
NEA spent the rest on things such as administration, overhead, politics and other leadership priorities.
That’s down from the just 10% of total spending NEA allocated to representing members in 2019.14, In fact, while the union’s total spending in 2020 increased by nearly $230 million over 2019, its spending on representation went down by over $6.6 million.15
Overall, NEA’s 2020 representational spending was the lowest it has been since the U.S. Department of Labor starting tracking disbursements for “representational activities” in 2005.16
As previously mentioned, the Wise Giving Alliance maintains at least 65% of a nonprofit’s total expenses should be on program activities.17 NEA’s representational spending falls far short and should be a cause for concern among members.
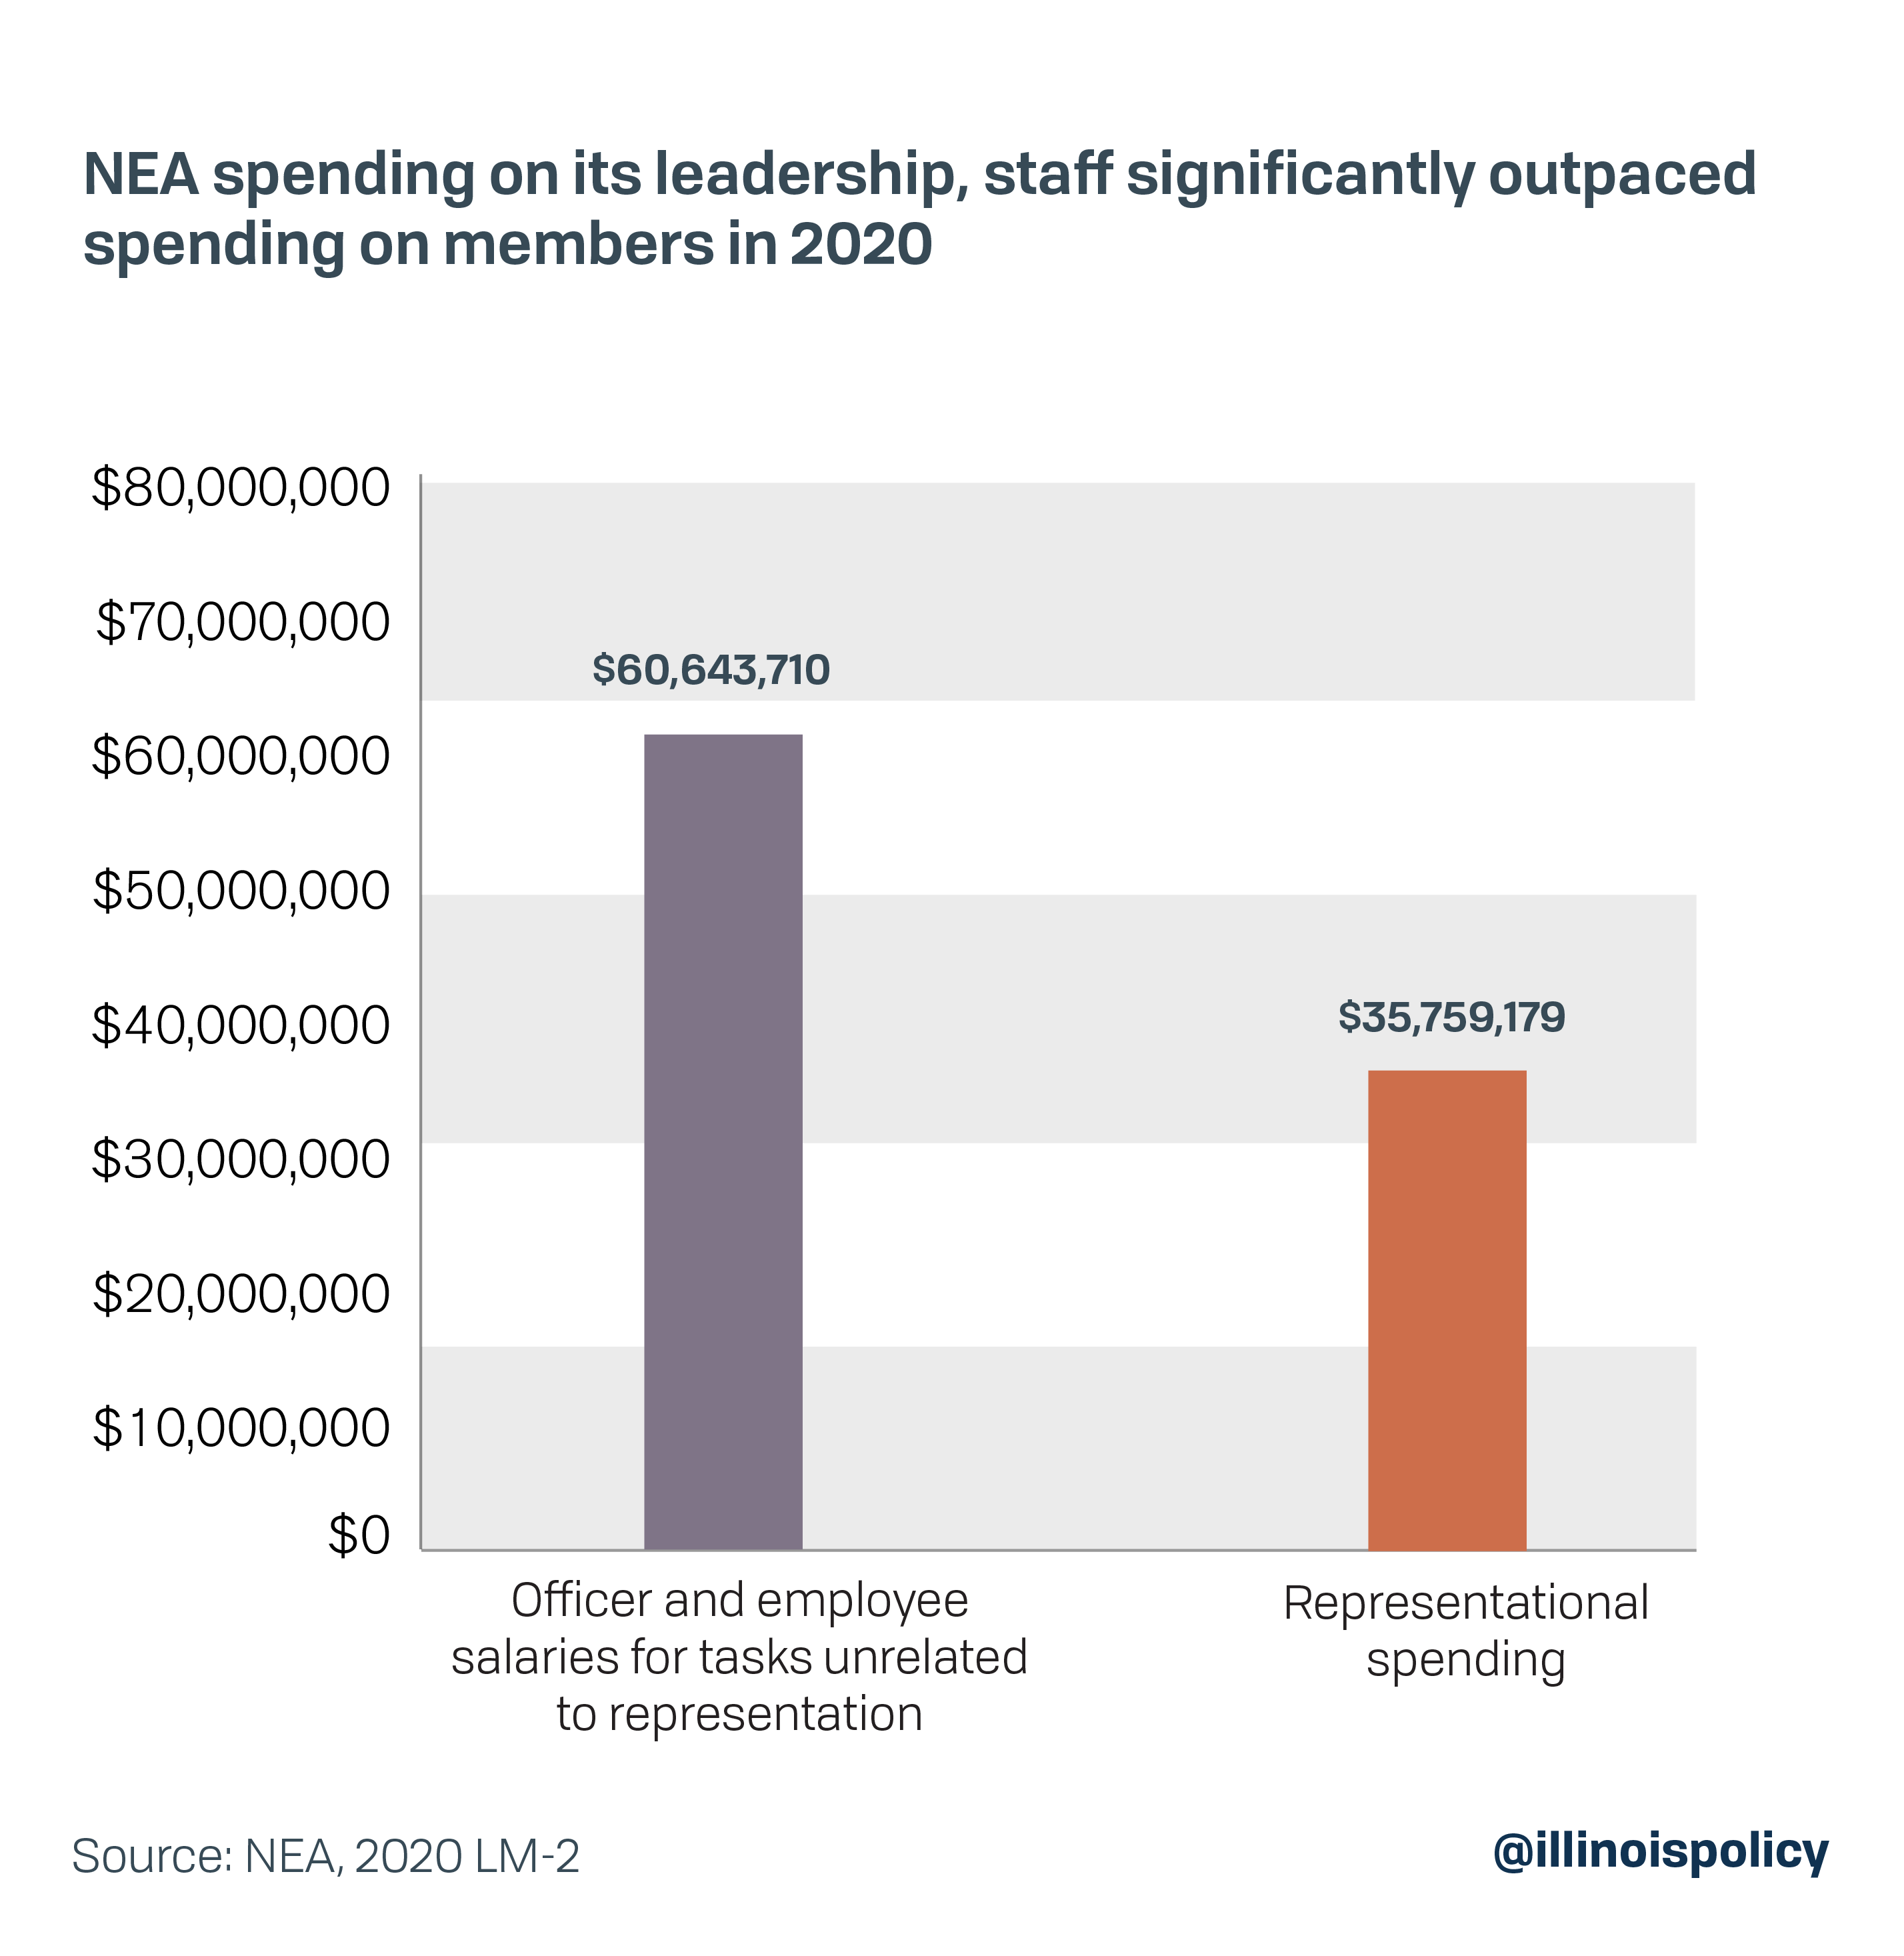
Spending on leadership: NEA spent over 69% more on its own leadership and employee salaries than on representing members
Not only was NEA’s representational spending down in 2020, it was also vastly exceeded by the union’s spending on its own officers and employees.
NEA reported it spent $60,643,710 for officer and employee salaries for tasks unrelated to representational activities in 2020.18
That’s over 69% more than its total spending on “representational activities.”
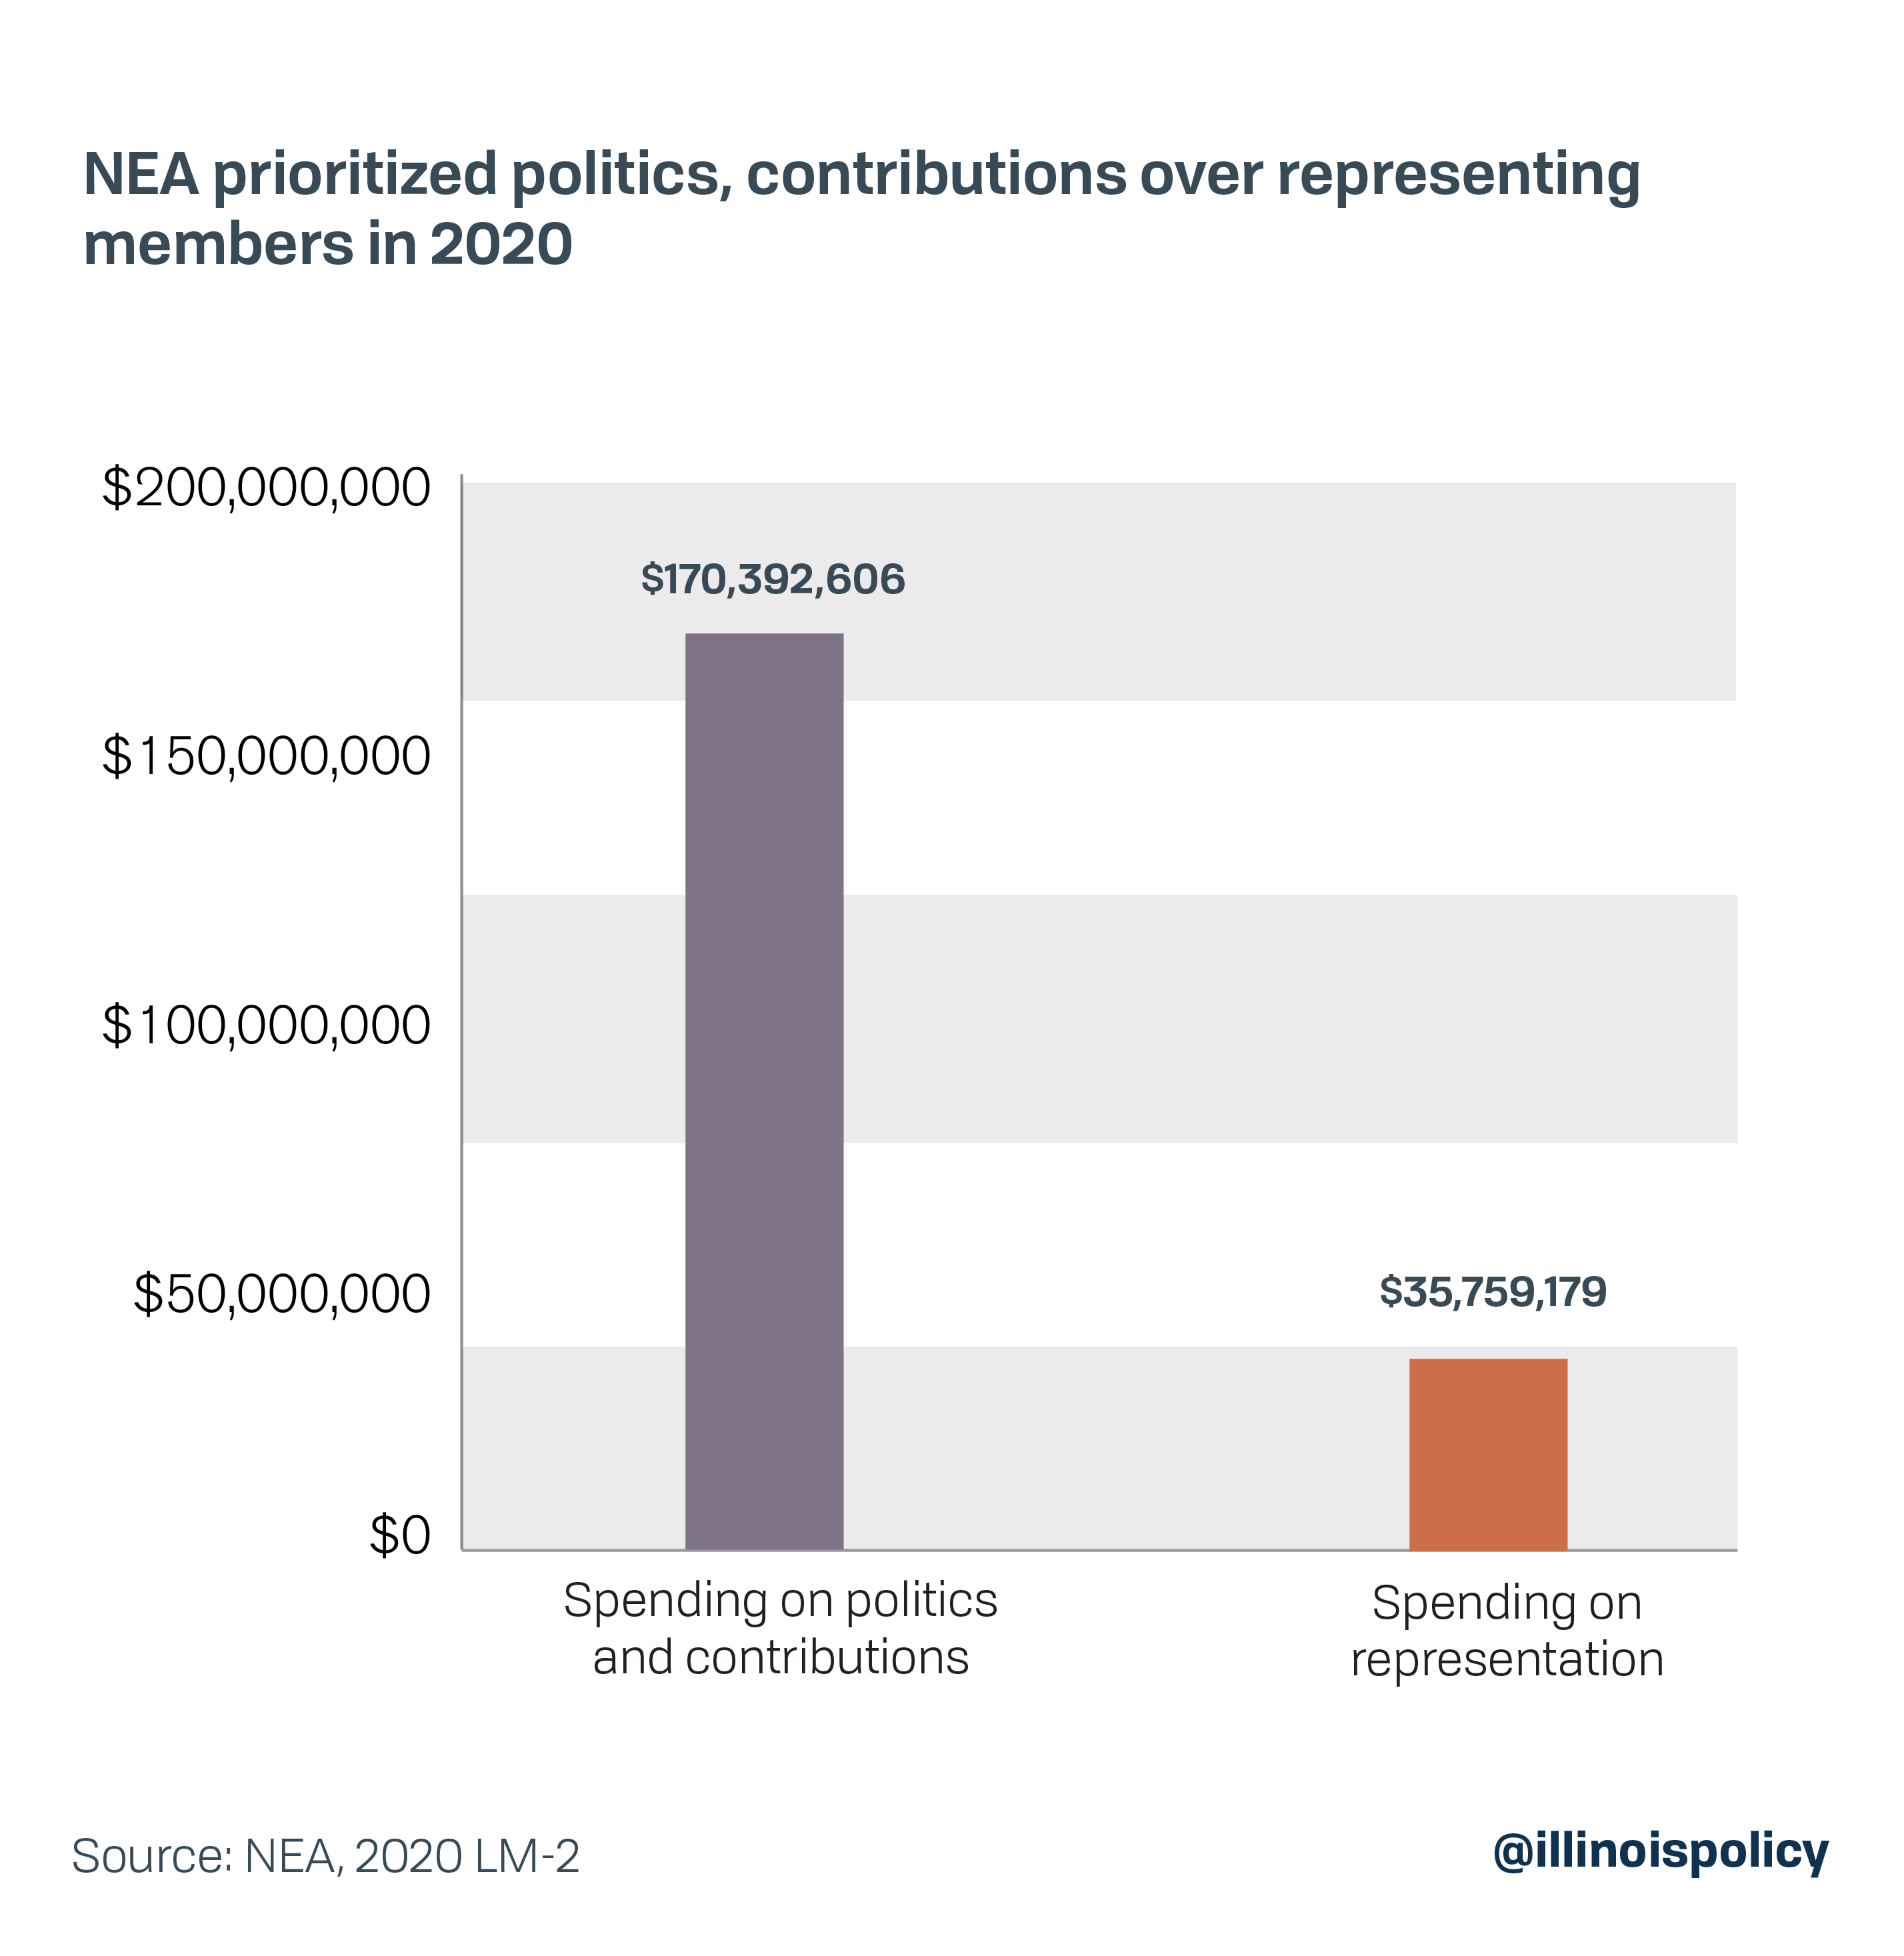
Political spending: NEA spent nearly five times more on politics and contributions than it did on representing members
NEA reported spending $50,728,949 on “political activities and lobbying” in 2020.19
In addition, it spent another $119,663,657 on other “contributions, gifts and grants,” which can be political in nature.20
Combined, that’s five times more than the union reported spending on representing members in 2020.
Examples of NEA’s political spending and contributions in 2020 include the following:
- Over $9.5 million to its own political action committees21
- Over $16 million to ballot initiatives, including at least $350,000 for the failed progressive tax ballot amendment in Illinois in 202022
- Nearly $20 million to self-proclaimed “progressive” organizations.23
Regardless of whether members support the causes NEA supports, it’s clear that the union prioritizes political causes over representing members.
Spending on affiliates: Not even one-onehundreth of NEA’s spending on affiliates went to Illinois-based affiliates
NEA disbursed nearly $119 million to its affiliates in 2020.24
Yet just over $411,000 – not even 0.01% of the total – went to Illinois-based affiliates.25
That’s even less than the 4% of affiliate spending dedicated to Illinois affiliates in 2019.26
While Illinois educators send thousands of dollars up the chain to NEA each year, NEA in turn sent money all over the country.
Conclusion
IEA and NEA’s LM-2 forms – the federal reports unions file, using their own accounting – show the patterns, practices and priorities of union leadership.
For many teachers, seeing how IEA and NEA spend money is disheartening.
But Illinois educators who want more control over their dues money have options:
- Teachers can get liability insurance and legal protection elsewhere. Educators can join other associations, such as the Association of American Educators. AAE, which has 25,000 members across the country, provides liability insurance and legal protection to public school employees – typically at a fraction of the cost of union membership.
- Teachers can opt out of union membership and keep all employer-provided benefits. By opting out of union membership, a teacher stops paying dues to the union yet retains all benefits that are provided in the collective bargaining agreement with the school district.
Opting out doesn’t mean educators don’t support their local bargaining unit. In fact, educators are free to send voluntary donations to their local bargaining units without being members – thereby helping to ensure their support stays local.
For more information, visit LeaveIEA.com.
Endnotes
1Only unions that represent private employees, U.S. Postal Service employees or most federal government employees are subject to reporting requirements under the Labor-Management Reporting and Disclosure Act of 1959 and the Civil Service Reform Act of 1978. United States Department of Labor, “Reports required under the LMRDA and the CSRA.” The Illinois Education Association and National Education Association must file the LM-2 reports because they take in $250,000 or more a year and represent some workers in the private sector.
2LM-2s are not without flaws. Unions are given great discretion in how they categorize spending. What’s more, unions do not have to itemize spending that falls below $5,000. See United States Department of Labor, “Instructions for form LM-2 labor organization annual report,” revised March 2020. Yet LM-2s provide insight into union spending because they provide a look into the union’s own accounting.
3Illinois Education Association, 2020 LM-2, Statement B – Receipts and disbursements (reporting $77,399,214 in total disbursements).
4Illinois Education Association, 2020 LM-2, Statement B – Receipts and disbursements (reporting $9,766,252 in spending on “representational activities”).
5These activities are defined by the U.S. Department of Labor as “the labor organization’s direct and indirect disbursements to all entities and individuals during the reporting period associated with preparation for, and participation in, the negotiation of collective bargaining agreements and the administration and enforcement of the agreements made by the labor organization.” United States Department of Labor, “Instructions for form LM-2 labor organization annual report,” revised March 2020. It also includes activities related to organizing a unit or warding off a decertification.
6Better Business Bureau, “BBB Standards for charity accountability,” 2020.
7Unions filing LM-2 forms are required to designate how much of officer and employees’ salaries are for what purpose, making it rather simple to calculate how much unions spend on salaries for purposes other than representing members. See Illinois Education Association, 2020 LM-2, Detailed summary page – Schedules 14 through 19 (reporting $14,813,858 in spending on officers and employees for political activities and lobbying, general overhead and union administration). That marks a 52% increase over the $9,766,252 it spent on representational activities.
8Illinois Education Association, 2020 LM-2, Statement B – Receipts and disbursements (reporting $1,056,288 on “political activities and lobbying”).
9Illinois Education Association, 2020 LM-2, Statement B – Receipts and disbursements (reporting $148,721 on “contributions, gifts, and grants”).
10Illinois Education Association, 2020 LM-2, Schedules 15-19 (reporting $779,907 in disbursements to affiliates in Chicago and Chicago suburbs).
11Illinois Education Association, 2020 LM-2, Schedules 15-19 (reporting $304,896 in disbursements to affiliates south of Interstate 80).
12National Education Association, 2020 LM-2, Statement B – Receipts and disbursements (reporting $650,887,633 in total disbursements). NEA’s 2020 disbursements greatly exceeded the $421 million the union spent in 2019. See National Education Association, 2019 LM-2, Statement B – Receipts and disbursements (reporting $421,043,748 in total disbursements).
13National Education Association, 2020 LM-2, Statement B – Receipts and disbursements (reporting $35,759,179 on “representational activities”).
14See Mailee Smith, “Illinois teachers pay for representation, but union spending rarely focuses on members: 2020 report on IEA and NEA spending,” Illinois Policy Institute, Summer 2020.
15See National Education Association, 2019 LM-2, Statement B – Receipts and disbursements (reporting $421,043,748 in total disbursements and $42,400,542 on “representational activities”).
16See National Education Association, 2019 LM-2, Statement B – Receipts and disbursements (reporting $42,400,542 on “representational activities”); National Education Association, 2018 LM-2, Statement B – Receipts and disbursements (reporting $42,485,096 on “representational activities”); National Education Association, 2017 LM-2, Statement B – Receipts and disbursements (reporting $43,704,842 on “representational activities”); National Education Association, 2016 LM-2, Statement B – Receipts and disbursements (reporting $46,503,911 on “representational activities”); National Education Association, 2015 LM-2, Statement B – Receipts and disbursements (reporting $48,236,412 on “representational activities”); National Education Association, 2014 LM-2, Statement B – Receipts and disbursements (reporting $44,915,308 on “representational activities”); National Education Association, 2013 LM-2, Statement B – Receipts and disbursements (reporting $44,287,632 on “representational activities”); National Education Association, 2012 LM-2, Statement B – Receipts and disbursements (reporting $50,638,469 on “representational activities”); National Education Association, 2011 LM-2, Statement B – Receipts and disbursements (reporting $50,659,498 on “representational activities”);National Education Association, 2010 LM-2, Statement B – Receipts and disbursements (reporting $49,557,966 on “representational activities”); National Education Association, 2009 LM-2, Statement B – Receipts and disbursements (reporting $49,260,204 on “representational activities”); National Education Association, 2008 LM-2, Statement B – Receipts and disbursements (reporting $49,801,796 on “representational activities”); National Education Association, 2007 LM-2, Statement B – Receipts and disbursements (reporting $48,884,532 on “representational activities”); National Education Association, 2006 LM-2, Statement B – Receipts and disbursements (reporting $50,433,648 on “representational activities”); National Education Association, 2005 LM-2, Statement B – Receipts and disbursements (reporting $46,953,204 on “representational activities”).
17Better Business Bureau, “BBB Standards for Charity Accountability,” 2020.
18National Education Association, 2020 LM-2, Detailed summary page – Schedules 14 through 19 (reporting $59,798,477 in spending on officers and employees for political activities and lobbying, contributions, gifts and grants, general overhead and union administration). That marks a 67% increase over the $35,759,179 it reported spending on representational activities.
19National Education Association, 2020 LM-2, Statement B – Receipts and disbursements (reporting $50,728,949 on “political activities and lobbying”).
20National Education Association, 2020 LM-2, Statement B – Receipts and disbursements (reporting $119,633,657 on “contributions, gifts, and grants”).
21National Education Association, 2020 LM-2, Schedules 15-19 (reporting $9,531,146 to NEA PACs).
22National Education Association, 2020 LM-2, Schedules 15-19 (reporting $16,392,450 for ballot initiatives).
23National Education Association, 2020 LM-2, Schedules 15-19 (reporting $19,694,950 to organizations that publicly proclaim or advocate “progressive” causes).
24National Education Association, 2020 LM-2, Schedules 15-19 (reporting $118,928,800 to affiliates nationwide).
25National Education Association, 2020 LM-2, Schedules 15-19 (reporting $411,334 to Illinois-based affiliates).
26See Mailee Smith, “Illinois teachers pay for representation, but union spending rarely focuses on members: 2020 report on IEA and NEA spending,” Illinois Policy Institute, Summer 2020