NEA dues rise, spending on teachers drops for 6 straight years
By Mailee Smith
NEA dues rise, spending on teachers drops for 6 straight years
By Mailee Smith
Published Aug. 10, 2022
Introduction
Illinois teachers spend hundreds of dollars a year in union dues, but most of that money doesn’t stay with their local bargaining units.1
Instead, their money flows up the chain to the state and national affiliates. For many teachers in Illinois, those are the Illinois Education Association and National Education Association.
And what those affiliates do with the money may surprise members.
For example, just 5% of the NEA’s spending in 2021 was on “representational activities,” according to documents NEA filed with the U.S. Department of Labor.2 According to the department, those are the activities “associated with preparation for, and participation in, the negotiation of collective bargaining agreements and the administration and enforcement of the agreements.”3
In other words, NEA spends very little on what is supposed to be its core function.
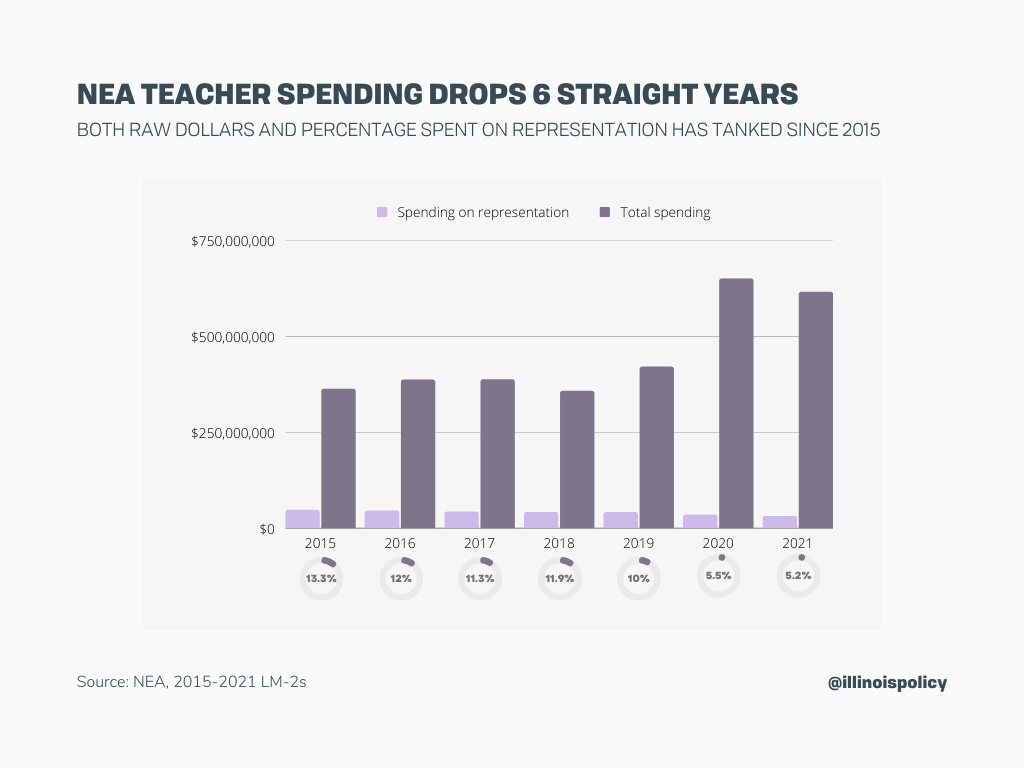
In fact, NEA’s spending on representation was down in 2021 for the sixth straight year, in both raw dollars and as a percentage of its total spending.4
Where does the rest of the money go?
Both NEA and IEA prioritize spending on leadership salaries over representing members. Both contribute enormous amounts to political causes that may not align with their members’ views.
Teachers deserve to know how their money is being spent – and it isn’t on advancing their best interests.
To assist teachers in evaluating NEA’s and IEA’s spending, this report examines data pulled from the unions’ LM-2s5 in the following three areas:
- Representational spending
- Leadership spending
- Political spending.
Just 6% of NEA’s and IEA’s combined spending was on representing members
IEA and NEA spent nearly $700 million in 2021.6
Yet only 6% of that spending was on representing workers – the core purpose of a union.
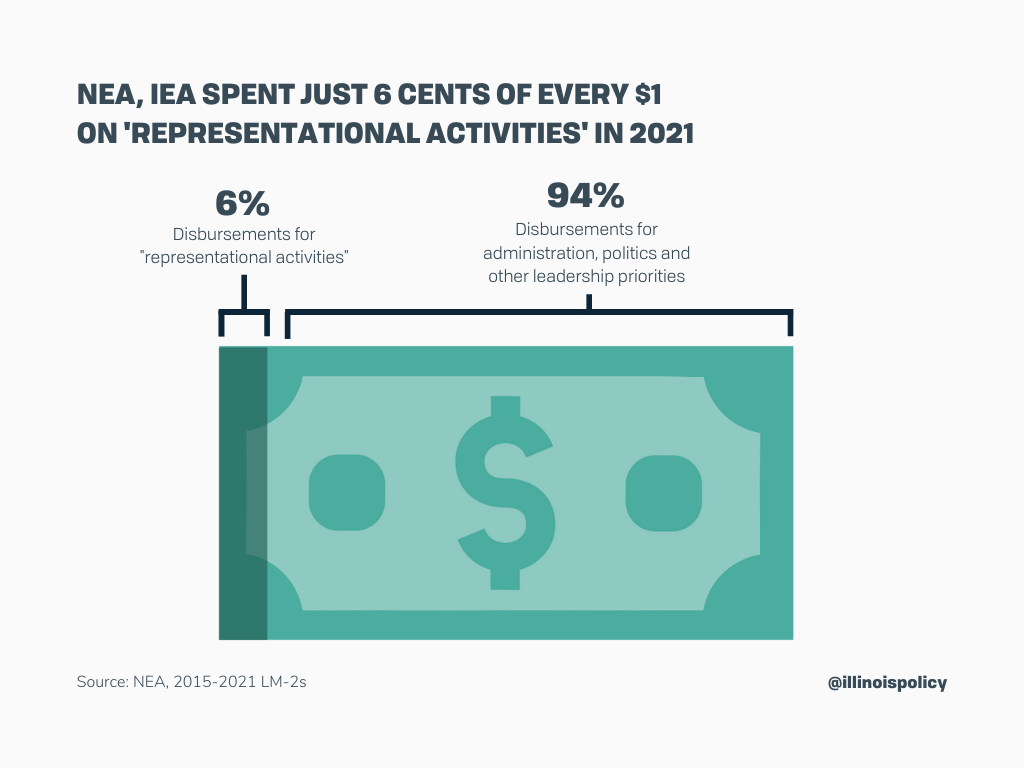
The rest was spent on administration, politics and other leadership priorities.
NEA’s negligible spending on members is particularly troubling. Not only has the amount of raw dollars it spends on representation decreased in the past six years, but its overall percentage of spending on members has gone down as well.
Yet while the total amount of dues NEA receives from members has gone up since 2015,7 the union is seeing its membership decline.8
That means fewer members are paying more money in dues to have the union spend less representing them.
IEA fares a little better when its numbers are reviewed separately, but not by much. In 2021, less than 15% of IEA’s spending was on representational activities.9
To place this in perspective, the Wise Giving Alliance, a project of the Better Business Bureau, maintains a nonprofit should spend at least 65% of its total expenses on program activities.10
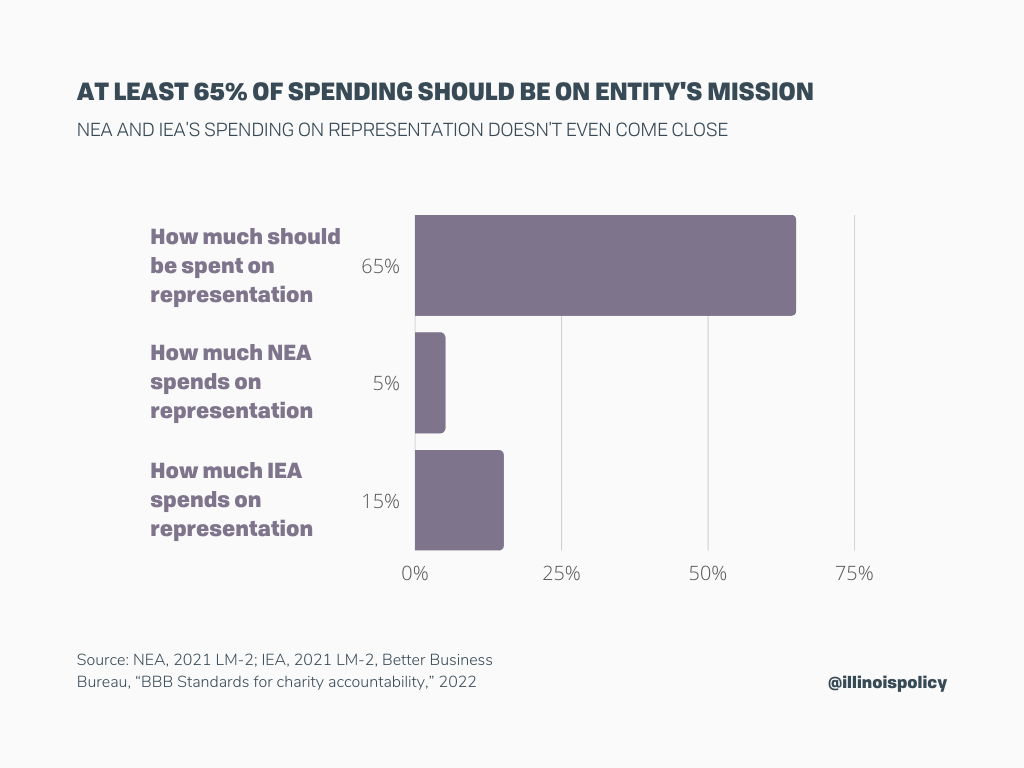
While the Wise Giving Alliance tracks spending by charities, it stands to reason that IEA’s spending of less than 15% on representation – the purpose of a union – should be a cause for concern among members.
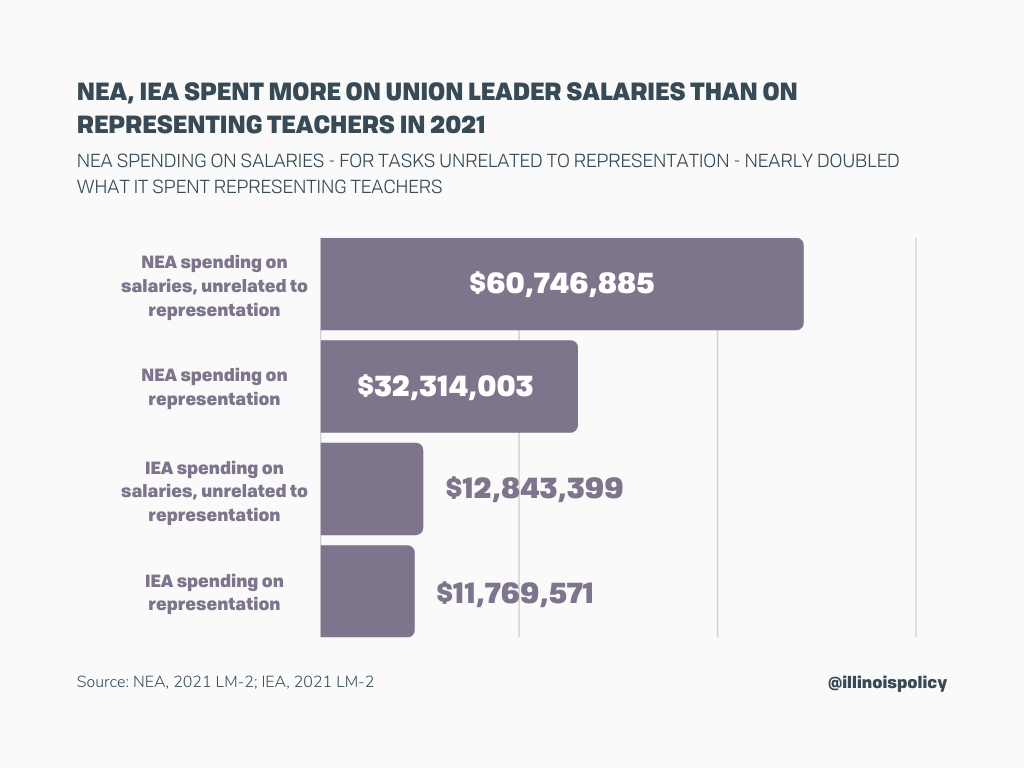
NEA and IEA spending on union leadership salaries outpaced spending on members
NEA reported spending $60.75 million on officer and employee salaries for tasks unrelated to representational activities in 2021.11
That’s nearly double what it spent on “representational activities” – such as negotiating and administering contracts.
Similarly, IEA reported spending $12.84 million on officer and employee salaries for tasks unrelated to representation, outpacing what the union spent representing teachers.12
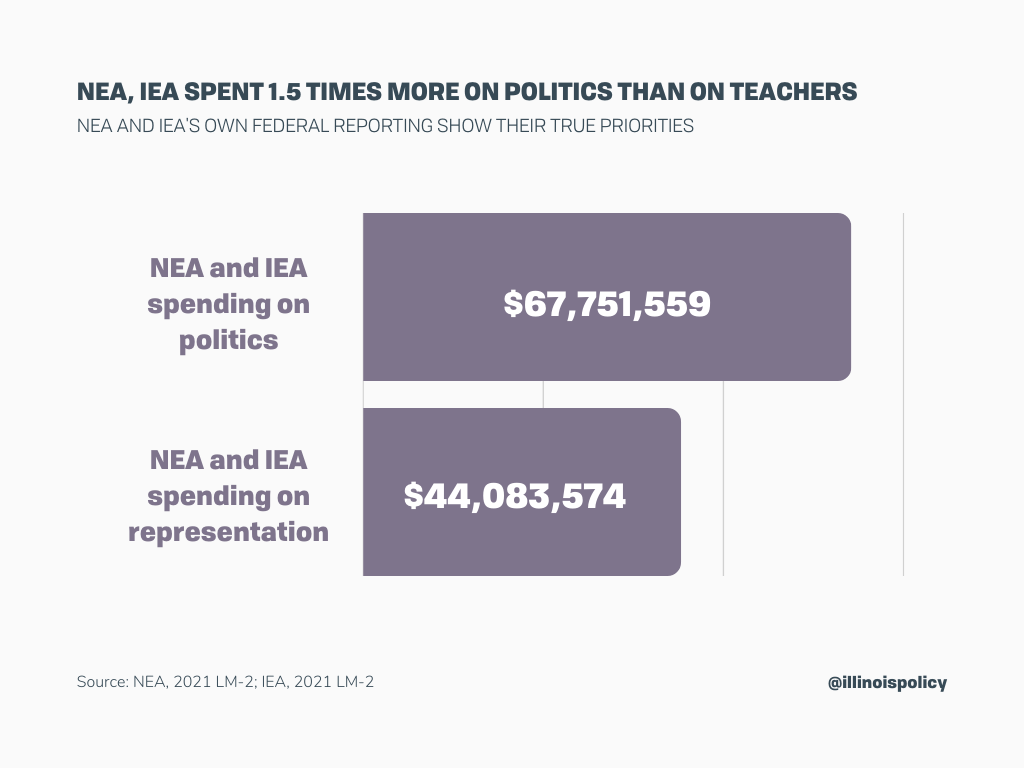
NEA and IEA spent 1.5 times more on politics than on representing teachers in 2021
NEA and IEA also prioritized politics over teachers in 2021. Combined, NEA and IEA admitted spending at least $67.75 million in “political activities and lobbying” – outstripping their spending on representing teachers by over $23 million.13
In other words, NEA and IEA combined spent 1.5 times more on politics than on representing members.
And that doesn’t include other contributions the NEA and IEA made, many of which can be political in nature. NEA spent an additional $117.8 million on “contributions, gifts and grants”14 – nearly four times more than it spent on representing teachers. IEA spent an additional $142,087.15
While unions may argue their lobbying is in the best interests of teachers, NEA’s 2021 LM-2 includes recipients many teachers may find objectionable. Examples of NEA’s political spending and contributions include the following:
- Over $5 million to self-proclaimed “progressive” entities
- Nearly $27 million on ballot initiatives, including $500,000 for an Illinois tax amendment that would have raised taxes on the middle class and retirees.
- Over $129,000 for a hotel for the presidential inauguration.16
It also sent nearly $16 million to its own political action committees. Once member money is funneled to a PAC, members have no say on how it is used.17
Conclusion
NEA and IEA’s LM-2 forms – the federal reports unions file, using their own accounting – show the patterns, practices and priorities of union leadership.
For many teachers, seeing how NEA and IEA spend money is disheartening.
But Illinois educators who want more control over their dues have options:
- Teachers can get liability insurance and legal protection elsewhere. Educators can join other associations, such as the Association of American Educators.18 AAE, which has 29,000 members across the country, provides liability insurance and legal protection to public school employees – typically at a fraction of the cost of union membership.
- Teachers can opt out of union membership and keep all employer-provided benefits. By opting out of union membership, a teacher stops paying dues to the union yet retains all benefits that are provided in the collective bargaining agreement with the school district.
Opting out doesn’t mean educators don’t support their local bargaining unit. In fact, educators are free to send voluntary donations to their local bargaining units without being members – thereby helping to ensure their support stays local.
For more information, visit LeaveIEA.com.
Endnotes
1For example, only 5.7% of District 87 teachers’ dues went to their local affiliate, Bloomington Education Association, in the 2017-2018 school year. The majority went to the Illinois Education Association and the National Education Association. See Mailee Smith, “Illinois’ teachers pay for representation, but union priorities rarely focus on members,” Illinois Policy Institute, https://www.illinoispolicy.org/reports/illinois-teachers-pay-for-representation-but-union-priorities-rarely-focus-on-members/. In 2019, the Illinois General Assembly passed a law prohibiting employers from disclosing the amount of money members pay in dues. See 5 ILCS 315/6(c-5).
2National Education Association, 2021 L-M 2, Statement B – Receipts and disbursements (reporting $32,314,003 in representational spending of $615,976,126 total spending).
3United States Department of Labor, “Instructions for form LM-2 labor organization annual report,” revised March 2020. It also includes activities related to organizing a unit or warding off a decertification.
4NEA, 2021 L-M 2, Statement B – Receipts and disbursements (reporting $32,314,003 in representational spending of $615,976,126 total spending, or 5.2%); NEA, 2020 LM-2, Statement B – Receipts and disbursements (reporting $35,759,179 in representational spending of $650,887,633 total spending, or 5.5%); NEA, 2019 LM-2, Statement B – Receipts and disbursements (reporting $42,400,542 in representational spending of $421,043,748 total spending, or 10.0%); NEA, 2018 LM-2, Statement B – Receipts and disbursements (reporting $42,485,096 in representational spending of $357,281,199 total spending, or 11.9%); NEA, 2017 LM-2, Statement B – Receipts and disbursements (reporting $43,704,842 in representational spending of $387,566,687 total spending, or 11.3%); NEA, 2016 LM-2, Statement B – Receipts and disbursements (reporting $46,503,911 in representational spending of $387,226,823 total spending, or 12.0%); NEA, 2015 LM-2, Statement B – Receipts and disbursements (reporting $48,236,412 in representational spending of $362,981,380 total spending, or 13.3%).
5LM-2s are not without flaws. Unions are given great discretion in how they categorize spending. What’s more, unions do not have to itemize spending that falls below $5,000. See United States Department of Labor, “Instructions for form LM-2 labor organization annual report,” revised March 2020. Yet LM-2s provide insight into union spending because they provide a look into the union’s own accounting.
6IEA, 2021 LM-2, Statement B – Receipts and disbursements (reporting $80,696,783 in total spending); NEA, 2021 LM-2, Statement B – Receipts and disbursements (reporting $615,976,126 in total spending).
7See NEA, 2021 LM-2, Statement B – Receipts and disbursements (reporting $377,396,654 received in dues and agency fees); NEA, 2015 LM-2s, Statement B – Receipts and disbursements (reporting $362,758,952 received in dues and agency fees).
8See NEA, 2021 LM-2, Schedule 13 – Membership status (reporting total 2,909,690 members and agency fee payers); NEA, 2015 LM-2s, Statement B – Receipts and disbursements (reporting 3,047,052 total members and agency fee payers).
9IEA, 2021 LM-2, Statement B – Receipts and disbursements (reporting $11,769,571 on “representational activities” and $80,696,783 in total spending).
10Better Business Bureau, “BBB Standards for charity accountability,” 2022.
11Unions filing LM-2 forms are required to designate how much of officer and employees’ salaries are for what purpose, making it rather simple to calculate how much unions spend on salaries for purposes other than representing members. See NEA, 2021 LM-2, Detailed summary page – Schedules 14 through 19 (reporting $60,746,885 in spending on officers and employees for political activities and lobbying, general overhead and union administration).
12IEA, 2021 LM-2, Detailed summary page – Schedules 14 through 19 (reporting $12,843,399 in spending on officers and employees for political activities and lobbying, general overhead and union administration).
13NEA, 2021 LM-2, Statement B – Receipts and disbursements (reporting $32,314,003 on “representational activities” and $65,999,387 on “political activities and lobbying”); IEA, 2021 LM-2, Statement B – Receipts and disbursements (reporting $11,769,571 on “representational activities” and $1,752,172 on “political activities and lobbying”).
14NEA, 2021 LM-2, Statement B – Receipts and disbursements (reporting $117,795,592 on “contributions, gifts and grants”).
15IEA, 2021 LM-2, Statement B – Receipts and disbursements (reporting $142,087 on “contributions, gifts and grants”).
16NEA, 2021 LM-2, Schedule 16 – Political activities and lobbying.
17NEA, 2021 LM-2, Schedule 16 – Political activities and lobbying.
18See Association of American Educators, “Illinois educators: You have rights and options.”