Unemployment 101: How to understand an Illinois jobs report
Monthly reports from the Bureau of Labor Statistics and the Illinois Department of Employment Security allow the public to see Illinois’ record for job creation and unemployment. Understanding the components of the reports, what they measure, and the significance of the data are key to assessing the state’s economic health.
Where do unemployment numbers come from, and how can the average person understand what they mean?
In the Prairie State, the Illinois Department of Employment Security, or IDES, releases monthly jobs data, which allow media outlets and the Illinois public to see the state’s record for job creation and unemployment. These kinds of numbers are available for every state, which makes it is easy to compare the performance of different states over different timelines.
The IDES data come from the federal Bureau of Labor Statistics, or BLS, which is a unit of the United States Department of Labor. The BLS is responsible for the collection and dispersal of labor market data, and IDES is the conduit through which the Illinois data are delivered to Illinoisans. IDES economists and statisticians work with peers at the BLS to understand and present the data to the Illinois public. The data usually focus on two headline numbers – the payroll jobs count and the unemployment rate.
This article serves as a general guide on how to understand the monthly jobs report.
The monthly jobs report is derived from two different surveys: Household and business
One of the most confusing things about the monthly jobs report is that it contains economic data from two completely separate surveys. These surveys are not directly influenced by each other and can, at least in the short run, say contradictory things about the Illinois economy.
One of the surveys is the Current Employment Statistics, or CES, survey, which is a survey of hires and layoffs at businesses, and provides the payroll jobs numbers. This survey can also be referred to as the business establishment survey or the payroll jobs survey. The other survey is the Local Area Unemployment Statistics, or LAUS, survey, which is a survey of Illinois households to measure whether people are in or out of the workforce, and whether they are employed or unemployed. This survey can also be referred to as the household survey or the unemployment survey.
Tracking jobs gains and losses: Understanding the business establishment survey
The business establishment survey tracks changes in the number of payroll jobs in Illinois and includes a breakdown by industry. This is a survey of approximately 10,000 businesses in Illinois to track their new hires and layoffs and uses this sample data to project the larger jobs picture for the state as a whole. Source data for this survey are available on the IDES page and the BLS page.
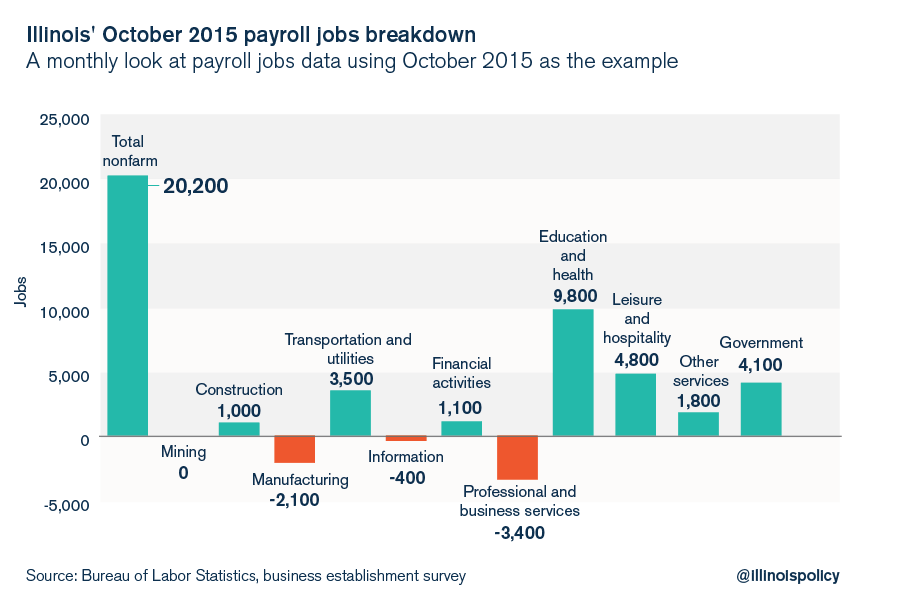
When the Illinois Policy Institute posts monthly jobs data from this survey, it usually looks like the image below, which shows the total change in payroll jobs on the left along with the breakdown by industrial components to the right. The example shown below is October 2015 when Illinois had its best monthly jobs showing in 2015 with 20,200 total jobs gained, but still showed a significant loss of 2,100 jobs in manufacturing.
The “Total nonfarm” bar on the left is equal to the sum of all the jobs gains and losses by industry, which are broken down to the right.
The business establishment survey has a number of strengths and weaknesses. Strengths of the business establishment survey include:
- Survey data come from business hires and layoffs
- The sample size is nearly 10,000 businesses, which is a fairly large sample out of about 300,000 total businesses in Illinois
- The survey breaks down jobs by industry, which provides valuable information
- Direct jobs growth comparisons can be made between different states and municipalities
Weaknesses of the business establishment survey include:
- Businesses are not required to respond to this survey, which can increase the margin of error
- The survey does not include farm workers
- The survey does not differentiate between full-time and part-time jobs
- Repeat counting of people who work multiple part-time jobs can occur. If someone loses a full-time job at 40 hours per week and moves to two part-time jobs each for 15 hours per week, that change is recorded as a net gain of one job by this survey even though that worker’s situation worsened.
More than just the unemployment rate: Understanding the household survey
The household survey tracks changes in the state’s unemployment rate. To do this, the survey measures the size of the state’s labor force, and within that labor force it measures the number of people who are employed and unemployed. Source data for this survey are available on the IDES page and the BLS page.
The labor force is always equal to employment plus unemployment.
Labor Force = Number of people employed + number of people unemployed
The unemployment rate is calculated using a fraction; that fraction is simply the number of people unemployed divided by the number of people in the labor force.
Unemployment rate = Number of people unemployed / number of people in the labor force
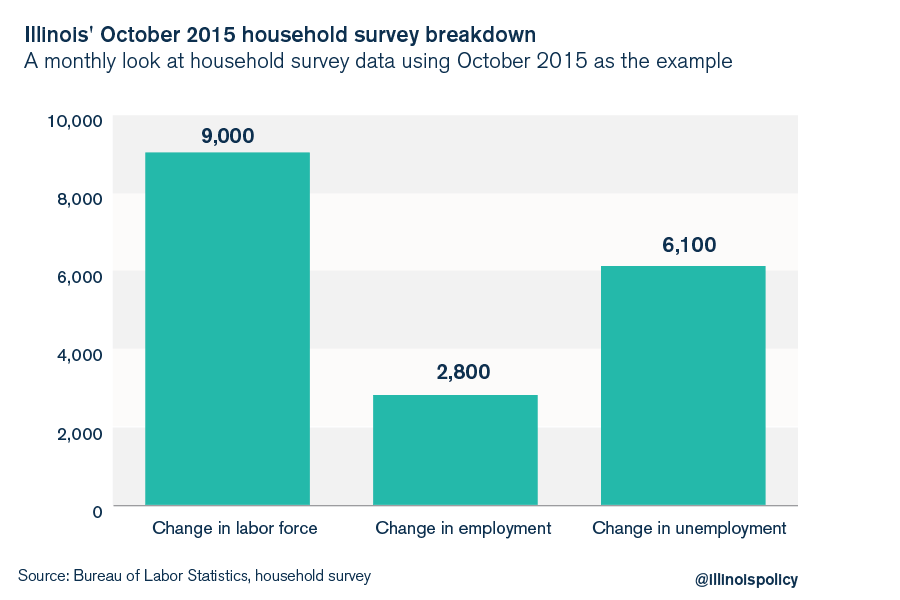
When the Illinois Policy Institute posts monthly data from this survey, the depiction usually looks like the image below, which shows the monthly change in the number of people employed and unemployed, which taken together are roughly equivalent to the monthly change in the size of the labor force. In the example of October 2015, the labor force grew by 9,000, driven by a net addition of 6,100 unemployed people and 2,800 employed people.
The unemployment rate is used as a general indicator of economic health. However, it can rise and fall for technical reasons that can confuse the analysis of this indicator.
In one example, a drop in the unemployment rate can indicate a difficult or worsening economic situation – unemployed people give up looking for work, drop out of the workforce and are no longer counted as unemployed. The following example can illustrate the point: If the labor force is made up of 6,000,000 people of whom 600,000 are unemployed and 5,400,000 are employed, the unemployment rate is 10 percent.
600,000 / 6,000,000 = 10 percent
Suppose that over the course of many months there are no new employment gains, and a lot of unemployed people give up looking for work. If the number of people employed stays the same while 200,000 of those unemployed people dropped out of the workforce, then the unemployment rate would drop. Specifically, there would be 400,000 unemployed workers in a workforce that has now shrunk to 5,800,000 people, for an unemployment rate of 6.9 percent.
400,000/5,800,000 = 6.9 percent
Such an event likely happened in Illinois in 2014, when the number of unemployed fell by 140,000, and the workforce simultaneously shrank by more than 70,000. The opposite has happened in the past half-year, as the workforce has been growing faster than employment, driving up the number of unemployed people and thus the unemployment rate. The unemployment rate has risen to 6.4 percent in February 2016 from 5.8 percent in July 2015 as employment has grown by more than 50,000, and unemployment has grown by 45,000.
The household survey has a number of strengths and weaknesses. Strengths of the household survey include:
- It’s a survey of actual families and households to determine the employment status of adults
- The survey provides key metrics and indicators such as labor-force participation rate, unemployment rate and employment rate
- The key metrics can be broken down by age group, gender and ethnicity
- The survey captures groups who aren’t on payrolls and therefore are missed by the establishment survey, such as farm workers, entrepreneurs and the self-employed, and gig-workers such as Uber drivers
Weaknesses of the household survey include:
- The monthly survey is of approximately 2,000 Illinois households, which is a much smaller sample size than the business establishment survey
- Employment is simply employment. The survey doesn’t differentiate between those who are employed for 1 hour per week and those who are employed for 50 hours per week
- Seeing general employment and unemployment does not allow for an analysis of which industries of the economy are doing well and which parts are struggling.
- The unemployment rate is subject to fall for bad economic reasons (workforce dropout) and can rise in the short term for reasons that aren’t completely terrible (strong workforce growth)
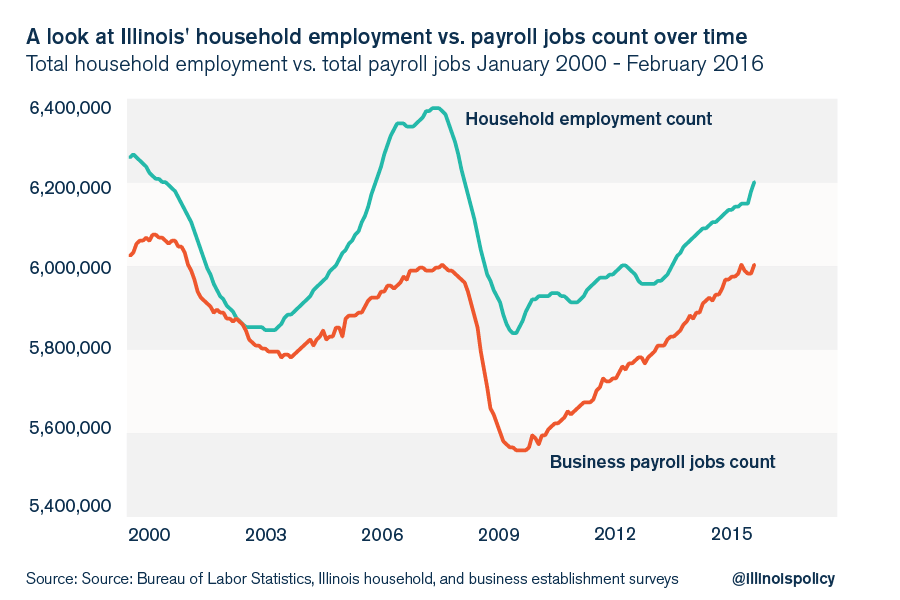
Finally, because the household survey captures the self-employed, farm workers and gig workers, it covers a larger population. Therefore, the total household employment number is almost always larger than the payroll jobs number. This makes sense, because the household employment number should broadly cover both those who work for companies and those who work on farms and for themselves, while the business establishment payroll jobs count only includes those who work for companies. One factor that can confound this comparison is the fact that one person holding multiple jobs is counted once as “employed” on the household survey, but he is counted multiple times for multiple jobs on the business establishment survey.
For example, when the two lines diverge, that might reflect increased self-employment, and when the two lines converge, that might reflect increased part-time work and multiple-job holding. Over time, both surveys will move in the same direction.