
Illinois state income taxes: Who really pays?
The top 18 percent of Illinois taxpayers cover more than 60 percent of the state’s income taxes, and the state’s millionaires pay 15 percent of Illinois’ income taxes.
When a high-net-worth person leaves a state, there are repercussions.
Take New Jersey. David Tepper was the Garden State’s richest man until he decamped for Florida, taking his investment firm and employees to warmer weather in a state with no income or death taxes. His departure left New Jersey budget officials second-guessing their income-tax revenue estimates, and with good reason. CNBC estimates that Tepper paid $500 million in income taxes to New Jersey over the last three years. According to New Jersey’s own budget experts, the loss of the state’s biggest taxpayer will put “an unusual degree of income-tax forecast risk” into Garden State budget estimates.
The loss of high-income taxpayers puts Illinois’ budget at risk too, although in a less obvious way. On the face of it, Illinois is less dependent than New Jersey on income-tax revenue from extremely high-income earners. In New Jersey, 31 percent of all income taxes come from people who make $1 million per year or more, while 15 percent of all income taxes in Illinois come from the same group. Illinois’ income-tax rate is currently a flat 3.75 percent compared with New Jersey’s top rate of 8.97 percent.
However, Illinois’ budget is still at risk due to taxpayer flight given the state’s record out-migration levels and millionaires leaving Chicago. The U.S. Census Bureau estimates that Illinois lost a record 105,000 people on net to other states in the past year alone. And a report from New World Wealth estimates Chicago was the only American city to see significant loss of millionaire households to other locales, with the Windy City losing 3,000 more millionaires than it gained in 2015. This unprecedented loss of wealthy families certainly casts Illinois budget projections in a new light.
Things will only get worse if House Bill 689, state Rep. Lou Lang’s updated progressive-tax bill, becomes law.
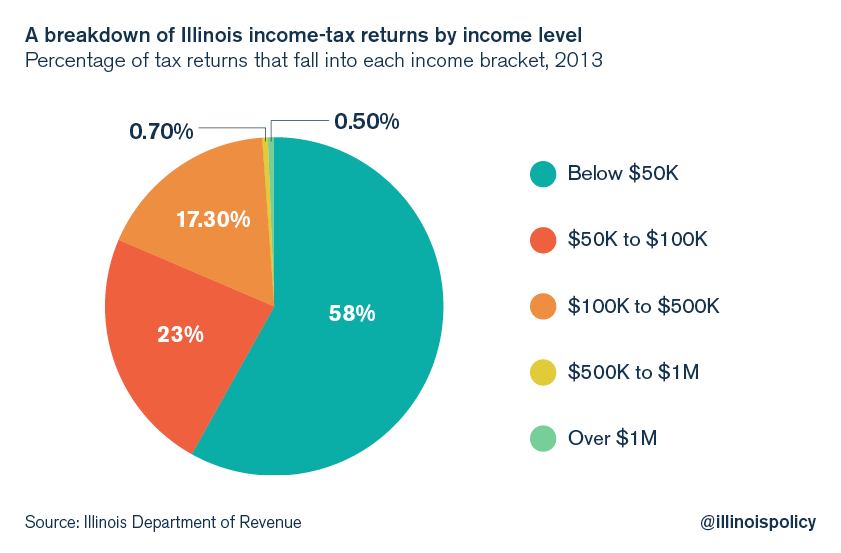
Here’s how Illinois income taxation looked in 2013, the most recent year of data from the Illinois Department of Revenue. There were slightly more than 6 million tax returns filed in Illinois that year. The population breakdown of who paid income taxes in Illinois by annual adjusted gross income, or AGI, is as follows:
- Those with annual AGI of $50,000 per year or less make up 58 percent of all tax returns (3.5 million).
- Those with annual AGI of $50,000-$100,000 per year make up 23 percent of all tax returns (1.4 million).
- Those with annual AGI of $100,000-$500,000 per year make up 17 percent of all tax returns (1.1 million).
- Those with annual AGI of $500,000-$1,000,000 per year make up 0.7 percent of all tax returns (45,000).
- Those with annual AGI over $1,000,000 per year make up 0.5 percent of all tax returns (32,000).
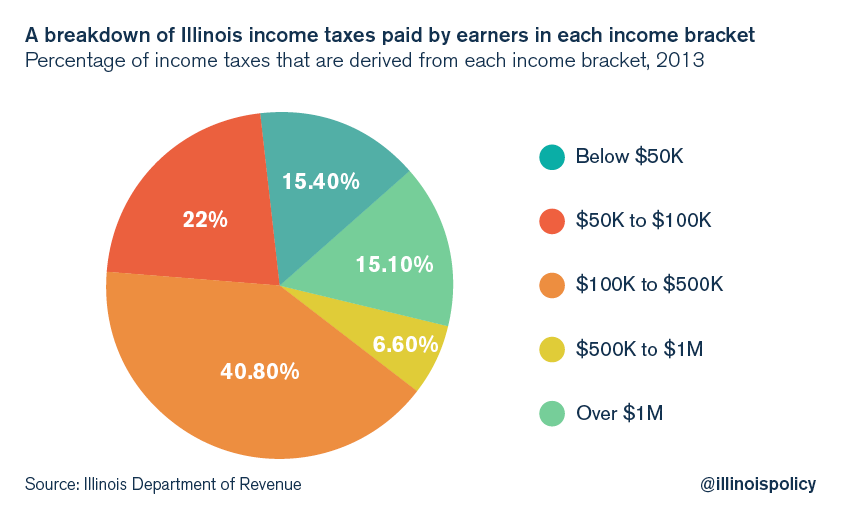
And here is a breakdown of the percentage of the total income-tax bill covered by Illinoisans by AGI tax bracket:
- Those with annual AGI of $50,000 per year or less pay 15 percent of all income taxes ($2.6 billion).
- Those with annual AGI of $50,000-$100,000 per year pay 22 percent of all income taxes ($3.7 billion).
- Those with annual AGI of $100,000-$500,000 per year pay 41 percent of all income taxes ($6.9 billion).
- Those with annual AGI of $500,000-$1,000,000 per year pay 7 percent of all income taxes ($1.1 billion).
- Those with annual AGI over $1,000,000 per year pay 15 percent of all income taxes ($2.6 billion).
The top 1 percent of Illinois tax returns paid 20 percent of the state income taxes in 2013, and those who reported AGI of $100,000 per year or more, the top 18 percent of Illinoisans, covered 63 percent of all income taxes.
The $100,000+ group, which covers a strong majority of the Illinois tax bill, is already in flight. While Illinois has not suffered a David Tepper-like loss, the mass out-migration of high-income Illinoisans is costing the state a significant amount of tax dollars.
Internal Revenue Service migration data now break down migration patterns by age group and income bracket, and the most recent year of tax migration data is from tax year 2013, filed in 2014. Comparing the tax returns of high-income people who moved to the state with the tax returns of those who moved out reveals how Illinois suffers from higher-income tax flight.
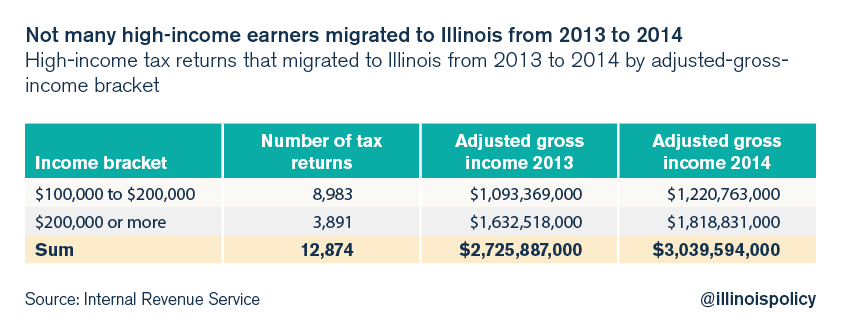
In the 2013 tax year, Illinois had a tax-migration gain of nearly 13,000 individual and household tax returns with AGI over $100,000 per year. These taxpayers earned a combined $2.7 billion of AGI in 2013 and $3 billion in 2014.
Illinois’ high-income tax-migration loss for the same year was much greater than its gain, with 22,500 individual and household tax returns showing an AGI of over $100,000 per year moving out of the state. These taxpayers earned a combined $5.4 billion of AGI in 2013 and $6.1 billion in 2014.
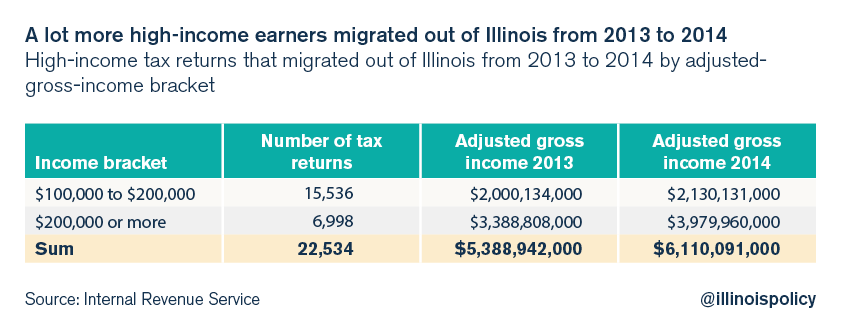
For the 2013 high-income tax migration trade-off, Illinois lost a net of 10,000 tax returns from individuals and households earning more than $100,000 per year, representing a net loss of around $3 billion of annual AGI.

If Illinois had simply not lost any high-income earners in 2013, the state would have an additional $150 million in income tax revenue at the 5 percent rate – the rate in effect in 2013 before it sunsetted to 3.75 percent in January 2015 – and $115 million at the 3.75 percent rate, to say nothing of lost sales taxes, property taxes and other government revenue. Furthermore, Illinois had significant net taxpayer losses from lower income brackets.
These losses add up and are compounded year after year. If the out-migration rate holds steady or climbs, then the net loss of $150 million of income-tax revenue in one year is doubled to $300 million after another year of migration losses, and $450 million after a third year. The out-migration tax loss builds on itself, and combined with weak economic growth, contributes to a situation in which the additional tax revenues that should flow into Illinois budgets due to organic growth are instead siphoned off to other states. In fact, the Commission on Government Forecasting and Accountability’s most recent budget estimates show that job losses and wage weakness thwart Illinois’ natural revenue growth. Add out-migration for a fuller picture of why tax revenue in Illinois grows very little without a tax hike.
In Illinois, and Chicago specifically, an ongoing outflow of taxpayers puts state and local budgets at risk. Policymakers should not meet the flight that is already underway with still more incentives for out-migration such as a progressive tax, a financial-transactions tax or a millionaire tax. Illinois and New Jersey should learn from the errors of the policies that have put their budgets in such a bind. It’s time to change direction.
* Note: Data about Illinois income taxes in this article are derived from tax year 2013 tax returns when the state income-tax rate was 5 percent. Tax year 2013 is the most recent year of tax and migration data available. This article takes the 5 percent rate as a given; the ratios of the income-tax breakdown would be substantially similar under Illinois’ current 3.75 percent rate, or any other flat rate.