Mandating unaffordability: How Chicago’s housing affordability requirements decrease supply and increase costs
By Josh Bandoch, LyLena Estabine
Download Report
Mandating unaffordability: How Chicago’s housing affordability requirements decrease supply and increase costs
By Josh Bandoch, LyLena Estabine
Download Report
As housing prices continue to soar out of reach for more Americans, an impulse from policy makers across the country has been to attempt to mandate “affordable” prices through legislation. One common idea is rent control, which limits how much landlords can increase rents on residents. A related one is inclusionary zoning, which forces developers to offer a portion of the units in new buildings at an “affordable” price to low-income residents.
Two-plus decades of evidence from Chicago shows those government mandates are counterproductive. They produce remarkably few units and limit the overall housing supply, driving up housing costs.
Chicago’s inclusionary zoning policy, known as the Affordable Requirements Ordinance, was first instituted in 2003 to apply to new construction of 10 or more units. After several updates, it now generally requires 20% of units to be offered at an “affordable” price for 30 years.
The Affordable Requirements Ordinance has only resulted in the construction of 2,798 units through 2024, concentrated in the most expensive neighborhoods in the city. At the same time, this ordinance has created a significant disincentive to build 10-plus unit buildings, which is one reason the city lags other large cities such as Los Angeles and Houston in the percentage of housing stock devoted to these larger buildings. Chicago also approves far fewer homes on average than the nine other largest cities. In 2023, Chicago granted permits for 1.36 units per 1,000 residents, while the other cities approved 4.71 per 1,000.
There’s widespread recognition Chicago has a housing affordability crisis driven by low supply. Those were key conclusions in Gov. J.B. Pritzker’s “Missing Middle” report and from Chicago Mayor Brandon Johnson’s “Cut the Tape” report, both issued in 2024.
The best way to make housing affordable is to build more housing of all shapes and sizes to meet diverse needs. Chicago needs to prioritize increasing supply and pursue housing abundance. Chicago’s housing abundance agenda should center on the following policies:
- Sunset the Affordable Requirements Ordinance at the end of 2026. If this change is too substantial, offer a six-month “holiday” from the ordinance to test what would happen if it were fully eliminated.
- Eliminate parking minimums so building larger properties is easier.
- Mandate objective criteria and automatically approve permits the city fails to handle by a deadline to provide developers with more certainty.
- Relax restrictions on what types of housing can be built in residential areas, beginning with allowing the construction of accessory dwelling units citywide.
Introduction
Soaring housing prices put the American Dream out of reach for far too many neighbors. Housing prices remain near record highs, with the median sales price nationally at $423,100 in the first quarter of 2025.1 Combined with high interest rates, Americans now face their highest median mortgage payments on record, even after adjusting for inflation.2 People cannot afford to live where they want, in the type of home they need or both. Well-intentioned attempts to address the problem are making it worse.
The problem is acute in Chicago, America’s third-largest city. In May 2025, home prices grew 6.09% year-over-year, second only to New York City among large metro areas.3 There are 42.7% of Chicago households “burdened” by housing costs, meaning they use at least 30% of their income for housing.4
With housing becoming increasingly unaffordable, one reaction is implementing policies that try to control the price. But limiting how much a landlord can charge for rent, or how much a landlord can increase it each year – known as “rent control” – is widely seen by economists as creating housing shortages and blight. That’s exactly what happened in the mid-20th century to New York City when it implemented rent control. Hundreds of thousands of rental units in the South Bronx and Harlem were abandoned. A couple of decades later the city rolled back the policy.5 Illinois proactively banned rent control because of its counterproductive effects.
But across the country, another less-direct policy known as inclusionary zoning has become a popular way to circumvent bans on rent control while still trying to force developers to reduce housing prices.
Inclusionary zoning is a housing policy that requires developers to provide a percentage of housing that’s deemed “affordable” to people of certain income levels, such as 60% of the area median income. New York City, Los Angeles, Boston, Seattle and other cities have adopted some variation on this policy.
Chicago has also adopted inclusionary zoning through its “Affordable Requirements Ordinance.” Since 2003, this inclusionary zoning ordinance has been at the heart of Chicago’s housing policy. The goal of this ordinance, which has been updated three times, is to increase the supply of “affordable” housing for low-income people, particularly in more expensive areas where they otherwise could not afford to rent or buy a home.
This report investigates the impacts of the city’s inclusionary zoning policy. What have its effects been? To what extent has it achieved its stated goals? Has it increased access to housing that is affordable, especially for people who need it most?
More than two decades of data provide a clear and disappointing conclusion: far from increasing the supply of housing that’s affordable, Chicago’s inclusionary zoning policy has made the city’s housing crisis worse. What’s more, the city’s attempts to mandate more affordability through stricter policies in 2015 and 2021 have had the opposite of the intended effect. Tighter regulations have disincentivized the construction of 10-plus unit buildings, resulting in both fewer “affordable” units and fewer units in general.
It’s time for a change. Armed with two decades of experience showing the Affordable Requirements Ordinance has been ineffective in achieving its goals, it’s time for Chicago to adopt a new approach to housing affordability, one tested and affirmed in cities such as Minneapolis and Houston: increase supply by significantly reducing harmful regulations that make it hard, often impossible, to build housing of all shapes and sizes to meet diverse needs. Recent scholarship has shown a connection between increased housing supply and slower growing rents and housing prices.6 In order to achieve those benefits, the city needs to relax zoning regulations to make building easier, rather than tightening them.
Social and economic harms of inclusionary zoning
Inclusionary zoning invites many practical problems. While failing to deliver on its stated goal of creating more “affordable” housing, these policies harm a wide range of people, including the low-income people they’re meant to help. They do so by reducing the housing supply and discouraging density.
Broadly speaking, the formula for improving housing affordability is simple: increase supply by providing more housing of all shapes and sizes to meet diverse needs. This is especially true for low-income people, even when the housing that’s built is more expensive. Yale University professor Robert Ellickson has explained building even high-quality, more expensive units helps housing affordability by setting off “a chain of moves that eventually tends to increase vacancy rates (or reduce prices) in the housing stock within the means of low- and moderate-income families.”7 Housing researcher Connor Harris shows this is true even for “luxury” housing rented to a wealthy household because it creates an opportunity for “chains of movement” to better units across all income levels, lowering market rents.8
When the housing stock increases, prices decline. Research shows when housing stock increased by 10% in an area, rents of housing within 500 feet decreased by 1%. When condo stock increased 10%, condo sales prices decreased by 0.9%.9 In a Chicago neighborhood such as Lakeview where the average home price is nearly $411,000,10 that would mean over $4,000 in savings. In the Lincoln Park neighborhood, where the average home price is around $624,194,11 the savings increase to over $6,000 plus the interest saved over 30 years on the loan.
Inclusionary zoning has led to a significant reduction in housing supply. One study of 383 programs across the country found 33% of them produced zero units. Of the 258 that produced at least one unit, the average number produced per year was 27 and the median was five.12 Washington, D.C.’s program only produced 60 units per year with an affordability requirement of 8% of units. Across the entire D.C. metro area, inclusionary zoning programs produced only 2,645 units in 56 permitting jurisdictions from 1994 to 2017.13 A study of New York City’s inclusionary zoning program showed from 2016-2020, only 2,065 affordable dwelling units had been approved in a city of 8.4 million residents.14 In a report on the San Francisco Bay area from 1973 to 2004, inclusionary zoning produced fewer than 7,000 units, or 228 per year.15
Case studies of places where inclusionary zoning has been implemented show how dramatic the decline in units built has been. In 2018, Cambridge, Massachusetts, increased its affordability requirement from 15% to 20%. As the economics of building homes became more challenging, the construction of new units plummeted. As an article in the Boston Globe explained, “Between 2011 and 2021, builders in the city broke ground on an average of 790 units annually. That number dipped to 491 in 2022, and 404 in 2023. In 2023, developers only finished construction on 39 units, according to city data.”16
In a study of inclusionary zoning in California, cities imposing affordability mandates saw higher prices and fewer homes. From 1980 to 1990, housing prices were 9% higher and there were 8% fewer homes. From 1990 to 2000, prices were another 20% higher, with 7% fewer homes available.17 In 45 San Francisco area cities where data was available, a study found from 1973 to 2004, “new construction decreases by 31% the year following the adoption of inclusionary zoning.”18 A study of Los Angeles showed production decreases significantly as the affordability requirements increase.19
Some inclusionary zoning policies appear to depress the number of units by discouraging developers from investing in larger buildings. Many inclusionary zoning policies only apply to buildings of a certain size. In Portland, Oregon, it applies to buildings over 20 units. While the number of 16- to 20-unit buildings built in 2020 increased by 143% over the 2014-2016 average, the number of 21- to 25-unit buildings plummeted to zero.20 A similar phenomenon occurred in London. Previously, the Greater London area applied affordability requirements to buildings with 15 or more units. From 2005 to 2008, those requirements were extended to 10- to 14-unit buildings. A report found “that the expansion led to a reduction in new developments in the target market segment (projects with 10 to 14 units) and an increase in new developments in the unregulated alternative market segment (projects with nine or fewer units.)”21
Disincentivizing development leads to a reduction in building permits, which leads to fewer units. In Portland, Oregon, the number of apartment permits issued has plummeted by nearly two-thirds, to fewer than 1,500 per year, as the city’s inclusionary zoning policy has taken effect.22 In a study of Fairfax, Virginia, average annual permits dropped by nearly 1,100 to 5,459 because of the county’s adoption of inclusionary zoning.23 As the number of units in the production pipeline decreases, supply cannot increase.
Inclusionary zoning directly increases the price of housing. One study found inclusionary zoning increased home prices by about 3% in San Francisco, suburban Boston and Washington, D.C.24 Another broader study from 2009 found inclusionary zoning had already increased prices by 2.2%.25
Part of inclusionary zoning’s appeal is it appears to be “free,” meaning the government is not funding or directly subsidizing developments. In reality, the costs of inclusionary zoning are substantial. In research on the Bay Area, in half of the jurisdictions the cost of selling each inclusionary unit was more than $346,000. In one-quarter of the jurisdictions, it exceeded $500,000.26 Those costs are borne by renters, potential home buyers and developers.
For a project to make financial sense, developers need to cover their costs and make enough profit to make the project worthwhile. This is true in relative terms, too, because they compare investment opportunities to each other and will pursue the ones where they stand to gain more. As a study from New York University explains, “developers may choose not to build at all, producing neither market-rate nor affordable housing, further exacerbating the city’s housing shortage.”27 That’s precisely what has happened in Chicago and will be illustrated in the following sections.
When developers do choose to build, market-rate renters bear the brunt of the costs of inclusionary zoning policies because they cross-subsidize “affordable” units in rental buildings. They do so directly by covering the difference between the rent on an “affordable” unit and the market rate. They do so indirectly, too, because developers sometimes build more expensive units that they can rent at higher prices to cover more of their costs. As Roger Valdez, director of the Center for Housing Economics, said, “When local governments add costs and reduce the ability to collect rent, the consumer costs of housing rise to subsidize the limited set aside units.”28 One undesirable result of all this is that “inclusionary” units are only feasible financially in areas with “relatively high rents.”29
When developers are required to provide a portion of units – 20% in Chicago – at an “affordable” price, they end up sustaining substantial financial losses on those units. To cover those losses, they must raise the price of the remaining market-rate units. One study stated, “As a result, the price of market-rate housing rises and the production of such housing declines. This decline in housing production can manifest as both a reduction in housing starts and as a reduction in housing size.”30
Longer affordability requirements also increase the costs on developers and market-rate renters and buyers. Many mandates stay in place for a period. In Chicago it’s 30 years.31 This means developers cannot rent “affordable” units at market rates until after that period. Shorter durations make development more viable.
Inclusionary zoning functions as a shadow tax on homes and housing development by both limiting supply and increasing the costs of the housing that is built.32
Inclusionary zoning’s higher costs hurt moderate-income families the most. High-income families can buy single-family homes in desirable neighborhoods even with these increased costs. Moderate-income families, by contrast, can’t bear the burden of these costs. The result is either they’re kept out of the housing market, or they can’t buy a home where they want.
Inclusionary zoning has many indirect economic costs, too. When fewer people live in an area, current businesses lose customers. New businesses are less likely to form when they have fewer potential customers. This means fewer jobs are created, and fewer services offered to communities.
The bottom line on inclusionary zoning is simple. As UCLA housing researcher Shane Phillips concludes from his study of the policy in Los Angeles:
“One of IZ’s fundamental shortcomings is that it does not address – and likely exacerbates – the housing scarcity that drives higher rents and home prices. It improves housing affordability for a few at the risk of worsening affordability for many, and it taxes precisely the activity needed to ameliorate the housing shortage and bring down rents: development.”33
Inclusionary zoning in Chicago: A brief history
This section examines the history of Chicago’s efforts to mandate housing affordability through inclusionary zoning ordinances.34 The ordinances were introduced in 2003, with the requirements ratcheted up in 2007, 2015, and most recently in 2021, to try to meet the city’s affordability goals. With each progressive adjustment to the Affordable Requirements Ordinance, the city has required more from developers. This has only worsened the ordinance’s impact on housing production.
The 2003 and 2007 ordinances
Chicago’s foray into inclusionary zoning began with the 2003 Affordable Requirements Ordinance. Because the city directly amended this ordinance in 2007, the 2003 and 2007 policies are considered together. All requirements in these ordinances were in effect for 30 years after a certificate of occupancy was issued for a property.
While the 2007 ordinance mostly builds on the 2003 ordinance, there is one notable addition: the 2007 ordinance cemented the ability of aldermen in whose ward a property would be built to approve or reject construction.35 This amendment further embedded what’s called “aldermanic privilege” or “aldermanic prerogative” into the city’s housing policy, whereby an alderman can veto projects in his or her ward.36
These ordinances require 10% of new units to be affordable.37 Technically, this requirement only applied to developments that need some form of approval (e.g. upzoning or rezoning) or financial assistance from the city (e.g. city land was purchased for the development).38 Because of Chicago’s strict zoning regulations, any project could easily qualify for some sort of use change, zoning approval, rezoning or receive some sort of benefit from the city. This means the ordinance could potentially be applied to any new development. If the city provided financial assistance, then 20% of units had to be affordable.39
In 2003, the metric for what counts as “affordable” was established in reference to what a household at 60% of the area median income could pay for a rental, and what a household at 100% of area income could pay to purchase a home. For example, in 2025 an affordable rental unit would be priced for a single individual making $50,400 each year or a family of three making $64,800. A home for purchase would need to be affordable for a couple making $96,000 or a family of five bringing in $129,500.40 In 2007, the city added the option for developers to produce fewer “affordable” units if owner-occupied housing is affordable to people at 80% of area income rather than 100%.41
These ordinances allowed developers to pay an “in-lieu fee” in place of building an “affordable” unit. The fee was set at $100,000, adjusted annually based on the consumer price index, per unit of affordable housing required to be provided. Developers could voluntarily pay the in-lieu fee; or, if they sold a unit above the “affordable” rate, the city would impose the in-lieu fee on the developer.42 In-lieu fees would then go into the city’s Affordable Housing Opportunity Fund.43 The fund put 60% of the money toward constructing or rehabilitating affordable housing, 20% into a trust fund and 20% toward an affordable rents program.44
The 2015 Affordable Requirements Ordinance
In 2015, the city attempted to further induce developers to build “affordable” housing with a new, more burdensome Affordable Requirements Ordinance. Its expressed purpose was “to expand access to housing for low-income and moderate-income households and to preserve the long-term affordability of such housing.” The city required the ordinance to be “liberally construed and applied to achieve its purpose.”45
For rentals, half of the units subject to affordability requirements now had to be affordable at 50% of area median income, down from 60%, and the other half still had to be affordable at 60% of the median income. For owner-occupied housing, half of the units needed to be affordable at 80% of the area’s median income, and the other half at 100%. The city shifted to using the U.S. Department of Housing and Urban Development number rather than the consumer price index to calculate affordability.46
The ordinance’s guidelines applied to buildings of 10 or more units. For rezoned buildings developed into residential property, the requirement was for 10% of new or additional – not total – units to meet the above affordability conditions. City land sales resulting in construction of at least 10 residential units also had to offer at least 10% of units as affordable. If a developer received financial assistance from the city, then at least 20% of the units must be affordable.47
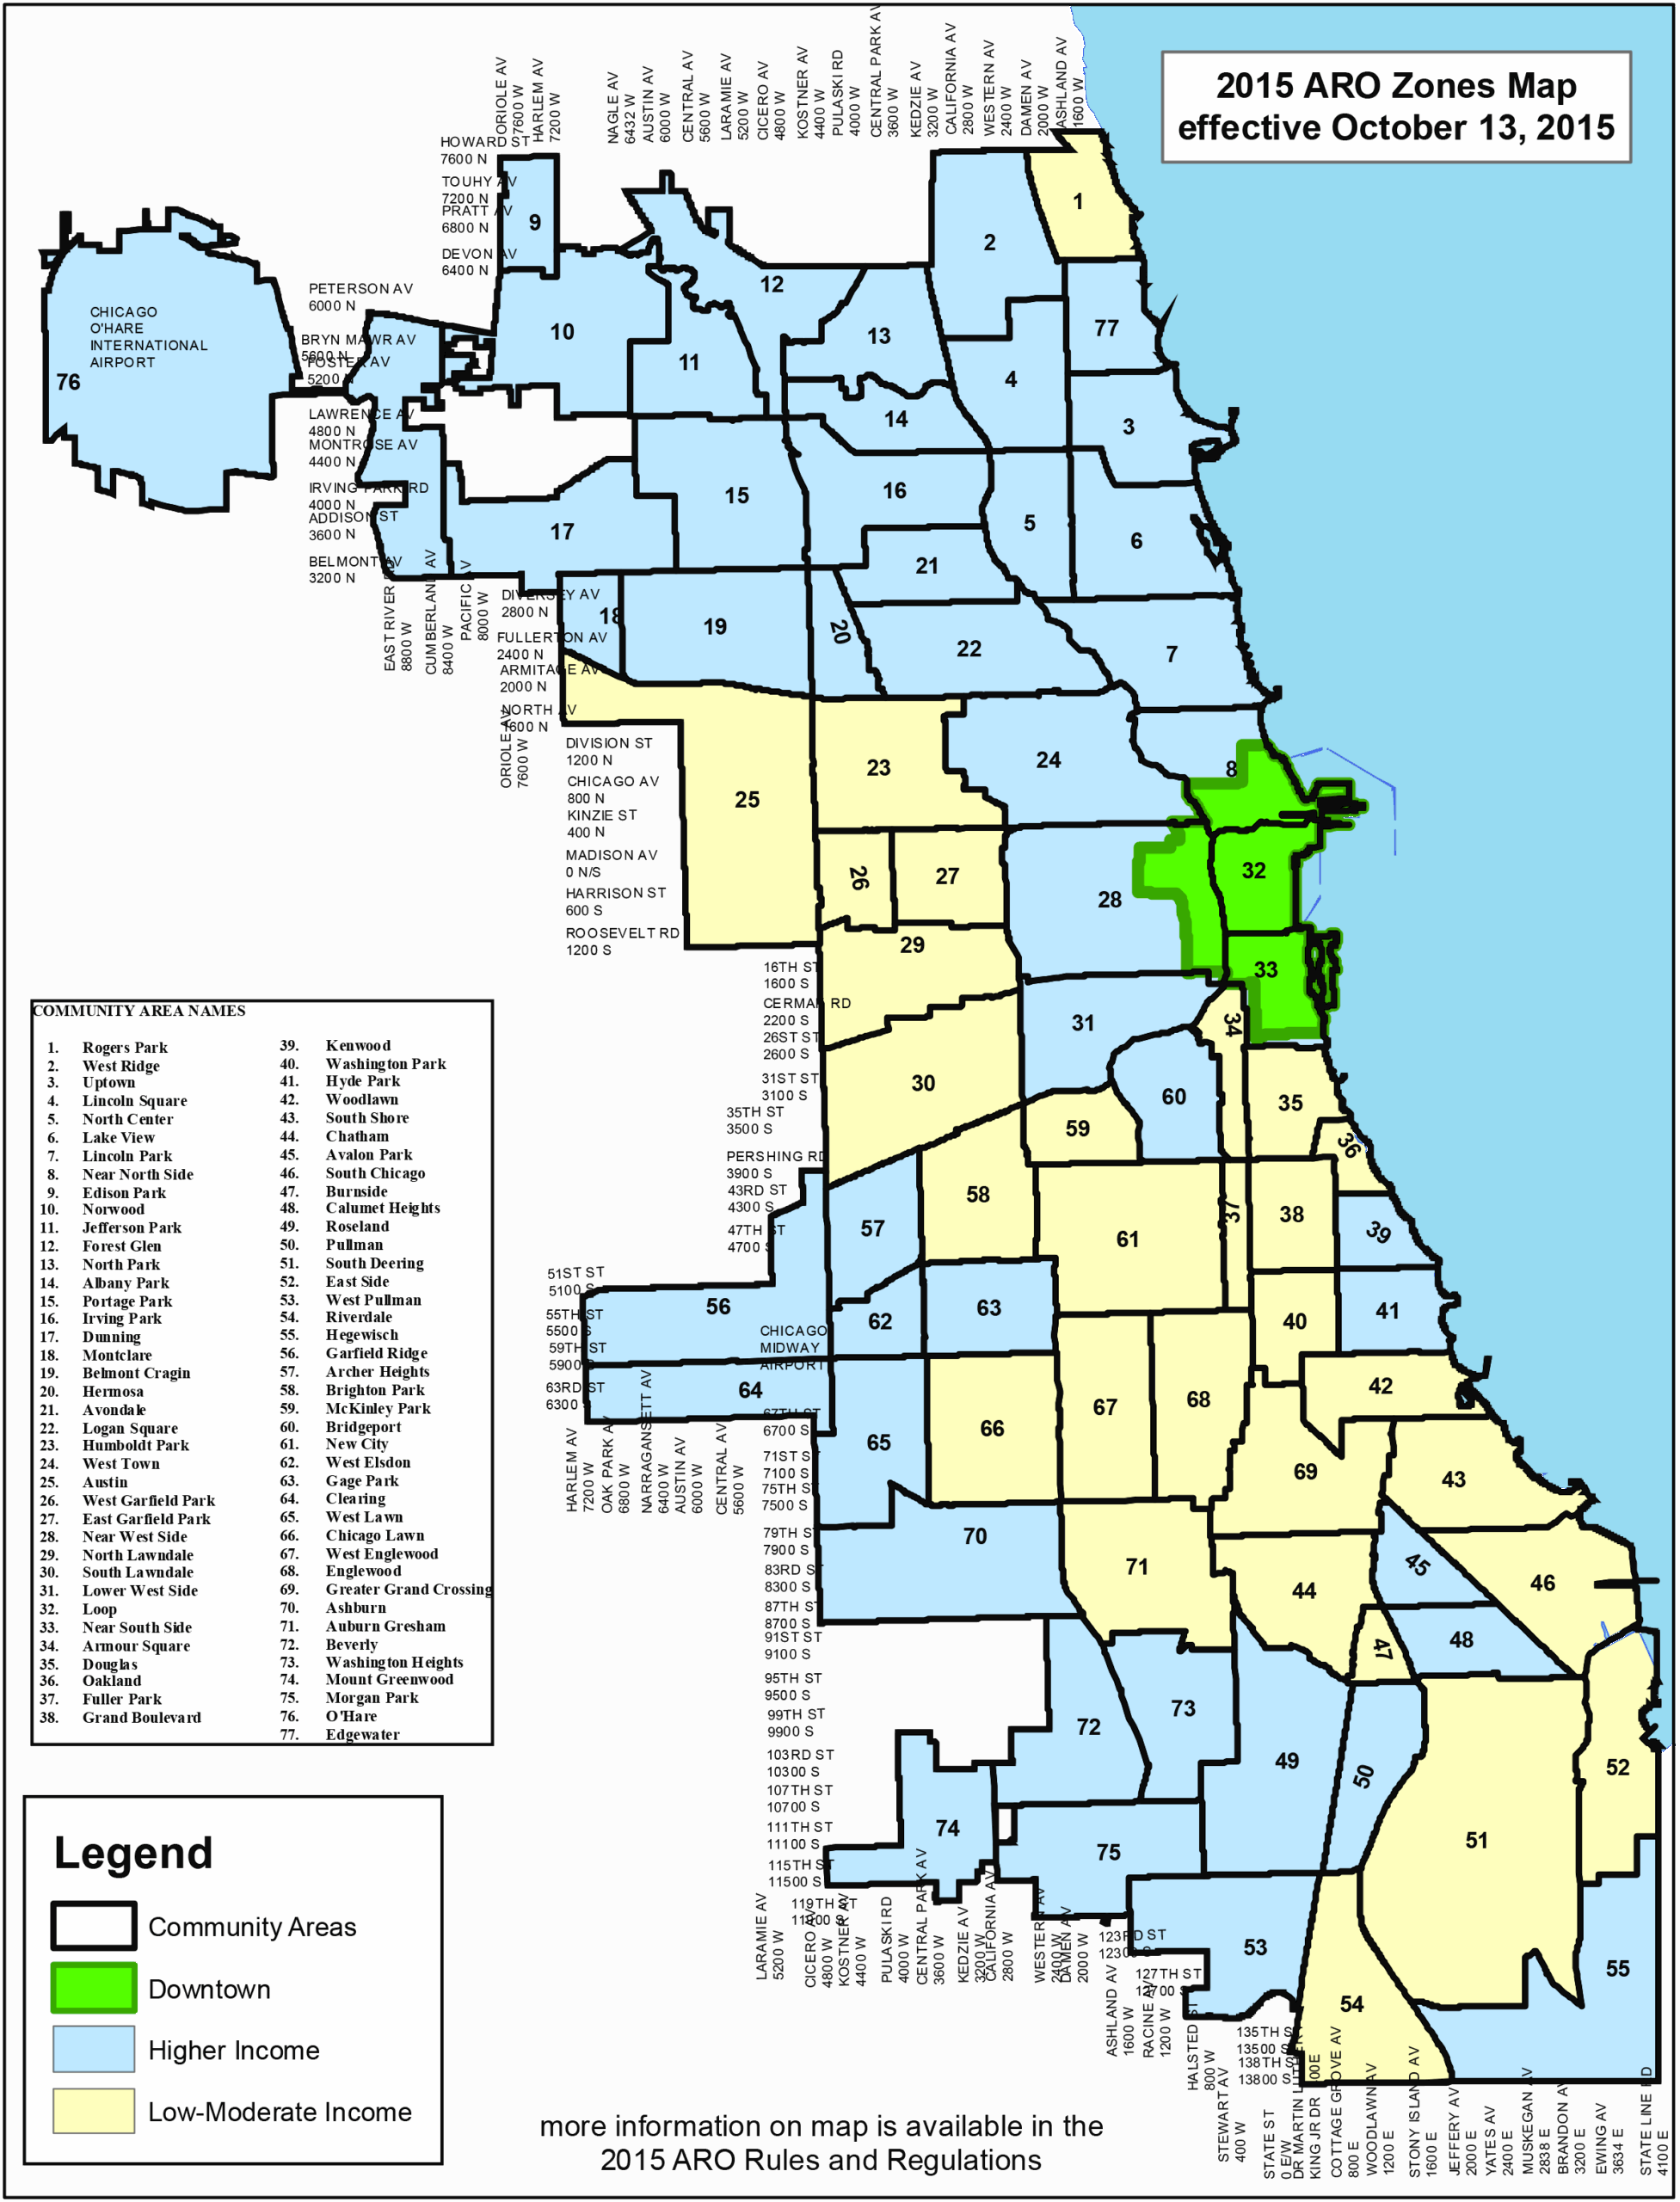
The 2015 ordinance did not apply to all areas equally, though. The city defined three areas that followed different regulations: low-moderate income, higher income and downtown. Downtown regulations varied based on the type of housing built (Figure 1).
The purpose of the last option on this list was to make it less appealing for developers to pay the in-lieu fee for all of the required affordable units rather than building them. All the above requirements would be in place for 30 years from when the unit was rented or sold.48
All money collected through in-lieu fees, unless redirected under special circumstance, went into the city’s Affordable Housing Opportunity Fund: 50% of would go to constructing, renovating or preserving affordable housing; 50% into the Low-Income Housing Trust Fund.49
The ordinance places various substantive restrictions on how to build affordable units:
- Any affordable housing built must be “reasonably dispersed throughout the residential housing project,” as opposed to concentrated in certain areas.50
- Affordable units must be comparable to market units “in terms of unit type, number of bedrooms per unit, quality of exterior appearance, energy efficiency and overall quality of construction.” The only exception is for projects with single-family detached homes.
- Developers can seek permission from the housing commissioner to make affordable units smaller than market-rate units in terms of lot size or number of stories.
- Affordable units can have different interior finishes and features “as long as they are durable, of good and new quality, and are consistent with then-current standards for new housing.”
- Affordable units must have access to the same amenities and parking options as market-rate units.51
- Affordable units must be marketed concurrently with market-rate units.
- If a developer builds affordable units off-site, they need “certificates of occupancy prior to issuance of the first certificate of occupancy for the market-rate units in the residential housing project.”52
On top of all these regulations, developers were required to “pay a fee of $5,000 per unit to pay the expenses of the Department in connection with monitoring and administering compliance with the requirements of this subsection.”53
The 2021 Affordable Requirements Ordinance
Chicago passed an updated Affordable Requirements Ordinance in 2021 because the city wanted more control over where units were built and to reduce the leeway developers had to opt out. We will focus on differences between the 2015 and 2021 ordinances, because there is substantial overlap.
In no case does the 2021 ordinance reduce restrictions on building and affordability. The 2021 ordinance adds on to all the above regulations in the 2015 ordinance. If a restriction is not mentioned below, then it remained the same or is nearly identical in the 2015 and 2021 ordinances.
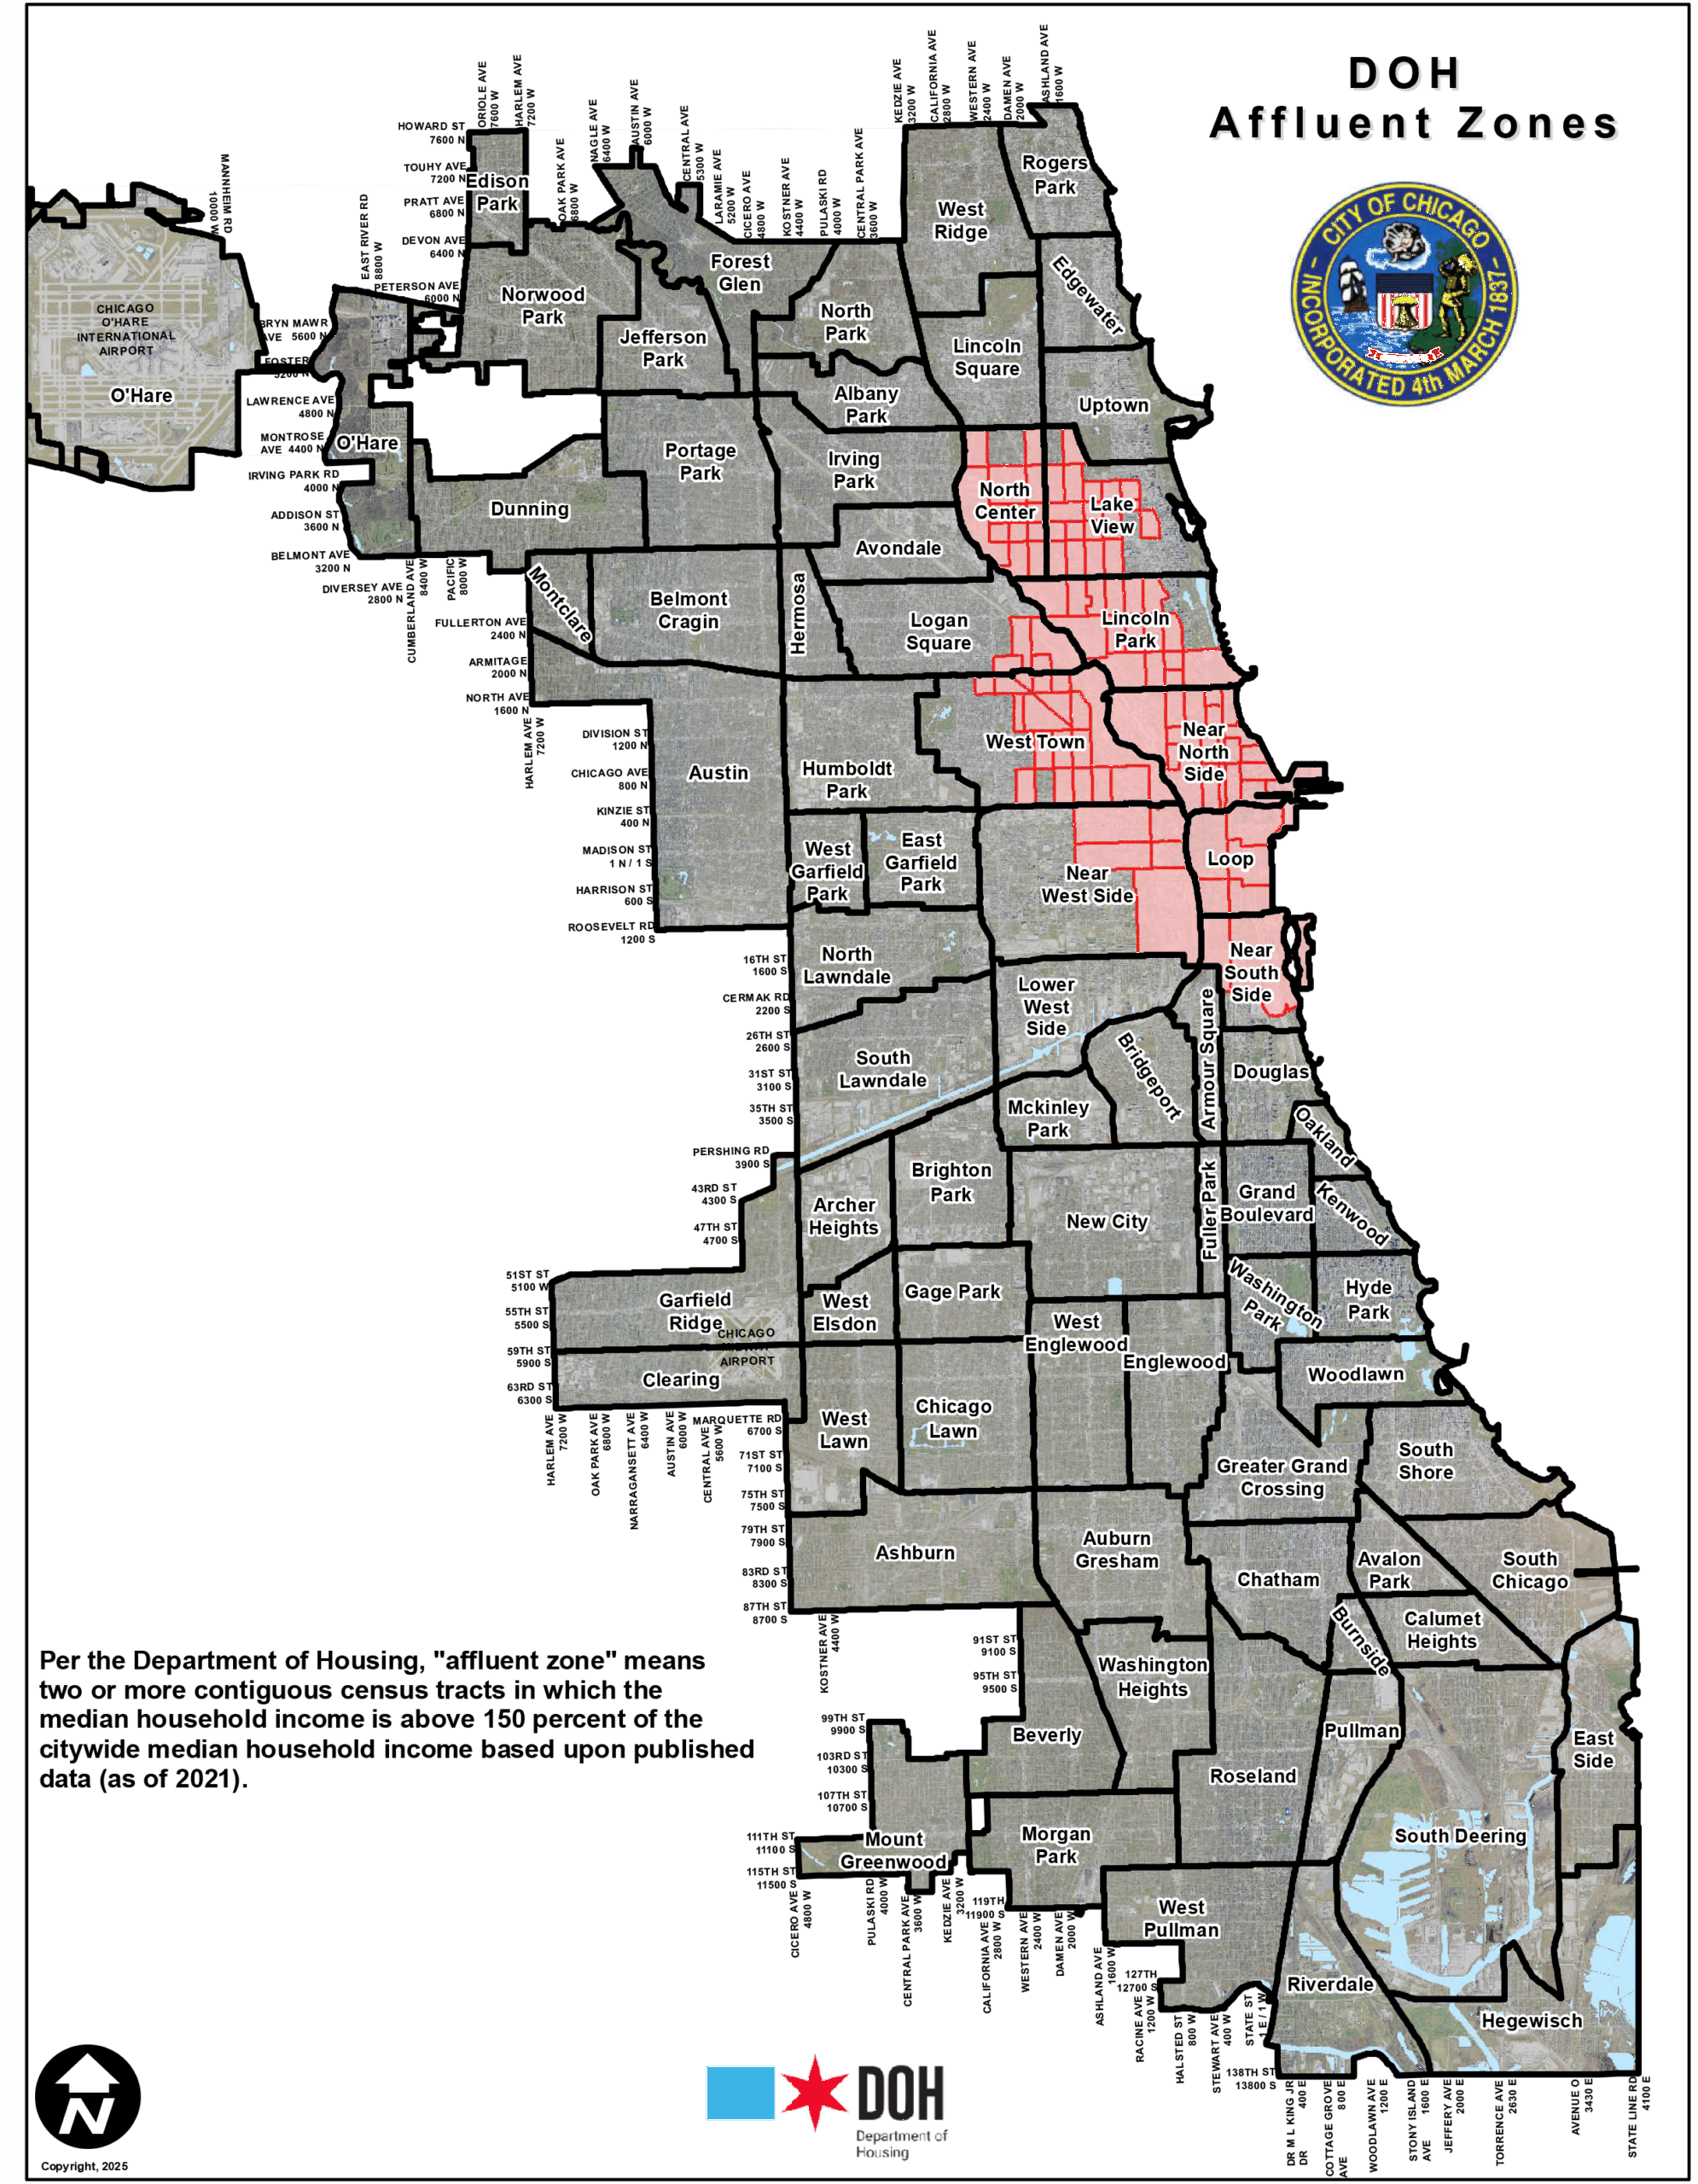
The 2021 ordinance added a few new zones to be regulated. An “affluent zone” is defined as “two or more continuous census tracts in which the median household income is above 150% of the citywide median household income based upon published data or includes either (a) the Loop community area, or (b) the Hyde Park community area.” The Chicago Department of Housing committed to “a map showing the boundaries of the affluent zones, and” updating “the map at least every five years but no more often than every two years.”54 As of May 2025, they have created one such map labeling these areas based on 2021 data (Figure 2).
A “community preservation area” contains displacement census tracts or vulnerable displacement census tracts. A displacement tract is one where there is “(a) an increase of at least 10% in median rent or home values, (b) an increase of at least 10% in the proportion of adult residents with a bachelor’s degree or higher, and (c) a loss of at least 100 low-income residents.” An area is “vulnerable” if “(a) its location in a community area that is adjacent to a community area containing an existing displacement census tract or to an affluent zone, and (b) published data demonstrating that at least 33% of the population in the census tract is below 200% of the poverty level.”55 These zones were established to fight gentrification.
The ordinance also created “inclusionary housing” areas. A community qualifies if: “(a) less than 10% of the dwelling units in the community area are legally restricted affordable housing, and the average income in the community area exceeds the area median income; or (b) less than 35% of the dwelling units in the community area are either legally restricted affordable housing or naturally occurring affordable housing.”56
The 2021 ordinance added a significant number of stipulations on affordable unit requirements.57
- Rental projects in “the downtown districts, inclusionary areas and community preservation areas shall provide 20% of the dwelling units in the project as affordable housing at a weighted average of 60% of the area median income, provided the maximum income level for any affordable unit in a rental project may not exceed 80% of the median income, and further provided that developers required to provide six or more on-site or off-site affordable units shall select one of the following options for compliance.” The city then outlines five options for compliance. For example, option 3 required 13% of units to be affordable at a weighted average of 40% of the area median income.
- Owner-occupied projects face two sets of requirements based on whether they’re for development downtown or in an inclusionary or community preservation area, or if they’re in a low-moderate income area. For example, downtown, 20% of units must be affordable at a weighted average of 100% of area median income, whereas in the inclusionary and preservation areas only 10% of units need to be affordable at a weighted average of 100% of area median income.58
The Affordable Requirements Ordinance has guidelines for off-site units. Every affordable unit off-site “must be located in a downtown district, inclusionary area or community preservation area.” If it’s in a community preservation area, it must be within one mile of the “triggering property.” All off-site units must be at least two bedrooms.59
Before any building permits will be issued, developers must enter an “inclusionary housing agreement” with the city, which contains stipulations including “the number, type, location, size and phasing of construction of all affordable units” and the “maximum qualifying incomes and maximum affordable rents or sale prices.”60
In an effort the incentivize creation of more “family-sized” units, developers now have the option to build fewer units with more bedrooms. For example, a four-bedroom affordable unit counts as 1.25 three-bedroom units or two one-bedroom units.61
The 2021 ordinance also created a requirement to give preference to veterans for at least 10% of the affordable units.62
Data analysis of Chicago’s Affordable Requirements Ordinance: 2003 to today
This section analyzes results of Chicago’s Affordable Requirements Ordinance since its implementation in 2003. The explicit goal of the ordinance was to produce more units of affordable housing across the city. In a city with an estimated need of 120,000 units of affordable housing, the goal is sensible.
Actual outcomes show the ordinance has failed to achieve this goal. For a city of Chicago’s size, remarkably few units of “affordable” housing have been produced since 2003: fewer than 2,800 over 21 years in a city of about 2.76 million people.63 It gets worse: the data shows the ordinance has created a significant barrier to the construction of more housing, both “affordable” and otherwise.
The city’s data collection presents certain challenges to performing this analysis. Although the city enacted its first Affordable Requirements Ordinance in 2003, it did not carefully record properties in that category. This means it is impossible to fully assess the impact of the 2003 ordinance, and there were some properties approved by the city council prior to 2007 categorized under the 2007 ordinance in city records.
Another data complication centers on the city’s method of recording whether units were built on or offsite. There is a category for “proposed units offsite.” This number is oftentimes the same as the number of “total ARO units on-site,” which makes it nearly impossible to determine how many – if any – of the units agreed to by the development were built offsite. For the most accurate measure, the analysis was limited to the units the city has recorded in the on-site unit category.
Through January 2025, there have been 365 developments for a total of 2,798 affordable units that have either been built or have been promised to be built under the ordinance (Table 1).
This equates to an average of about 17 buildings per year. Within those buildings, fewer than 140 total units were built per year – low figures for such a large city. In the same amount of time, 139,134 units have been authorized in Chicago, meaning these affordable units represent just 2% of all new housing stock.64 A breakdown of the number of developments and units created can be seen in Figure 3.
The pace of affordable unit construction has also slowed over time. Since 2021, the yearly average has dropped to 137. As seen in the previous section, the 2021 ordinance significantly increased in-lieu fees, leading developers to avoid building much of anything that qualified under the ordinance. The city’s more robust affordability requirements have resulted in fewer – not more – affordable units.
We can speculate the uptick in approvals in 2021 was in anticipation of the more stringent ordinance going into effect beginning in 2022.
Chicago’s attempt to incentivize larger units for families appears to have been unsuccessful. The city now offers the option for developers to build fewer total affordable units if the affordable units are larger three- and four-bedroom units. Based on the imperfect data available,65 it seems there is a strong tendency among developers to build smaller units, mostly studios and one-bedrooms (70%). Five percent were three- or four-bedroom, which shows this incentive did not produce the intended outcome.
The bonus has not provided housing to meet the needs of low-income families requiring more space.
Another primary objective of the Affordable Requirements Ordinance was to establish “affordable” units in higher income areas to give lower income residents access to those areas. An examination was conducted of where units have been built under each version of the ordinance, starting with the 2007 ordinance because the city does not have data for the 2003 ordinance. Ordinance properties are mostly built in areas with relatively high rents which are used to offset the cost of affordable units.
The 2007 ordinance did not establish separate regulations for higher income areas. That began in 2015. Still, 98.8% of the 1,383 units built or paid for were concentrated in neighborhoods that would later be categorized as higher income or downtown areas where rents are usually more expensive (Figure 4).
Of the 520 units built, 517 were built in downtown or higher income areas. Of the 863 units where in-lieu fees were paid rather than built, 850 were within properties built downtown or in higher income areas. This suggests developers found it more profitable to pay the one-time fee rather than building a rent-capped unit. This is important, because later versions of the ordinance made it much less appealing for developers to pay in-lieu fees.
A similar pattern of building almost exclusively in more expensive neighborhoods has persisted through the 2015 and 2021 ordinances’ mandates. Almost all new properties are on the North Side of Chicago in areas where the housing market is strong and rents are high.
In 2015, 98.5% of units were built in higher income areas. There were 40.1% built in the “higher income zone,” 38.8% in the Near North/Near West Pilot Areas and 19.6% built downtown. This is not surprising, because in these areas rent-capped units can be subsidized indirectly through higher prices paid by renters in these neighborhoods’ strong housing markets. As costs soar in these areas, renters pay ever higher prices, in part because supply cannot expand. Only 28 units, or 1.5%, were built in low-moderate income zones (Figures 5 and 6).
In 2015, there also was a significant reduction in the number of units developers paid for through in-lieu fees rather than building. Of the 2,545 affordable units owed, 678 (26.6%) were covered through fees, down from 62.4% under the 2007 Affordable Requirements Ordinance. Figures for 2015 show in-leu fees brought in over $98 million, down from over $107 million under the 2007 ordinance.
The city recognized the 2007 Affordable Requirements Ordinance was not yielding its intended outcomes by establishing numerous pilot areas with different building regulations. They were crafted to further dictate how development could happen within certain areas to ensure more units were created in particular areas.
The Near North/West Pilot area is one example.66 This pilot program applied to parts of the Near North and Near West community areas just outside the Loop. The stated purpose was:
“to establish modified affordable housing requirements for designated neighborhoods near the central business district that are experiencing gentrification or are at-risk of gentrification. The goals of these modified requirements are to mitigate the displacement impacts associated with gentrification, better protect the interests of the area’s economically vulnerable residents from demographic and housing market change, and preserve the economic diversity critical to a healthy economy.”
To do this, properties in the Near North/West Pilot Areas:
- Did not have the option to pay a fee in lieu of the establishment of affordable units.
- Were required to produce affordable units equal to 20% of the total units rather than 10% in the Near North Zone and 15%67 of the total units rather than 10% in the Near West Zone.
- Had to keep any off-site units within a two-mile radius of the residential housing project and either: (a) in a higher income area or downtown district, or (b) within the Near North/Near West Pilot Area, regardless of the income area in which the residential housing project was located.
- Had to keep all affordable units onsite if the project received any financial assistance from tax increment financing funds.
These higher affordable-to-market-rate-unit ratios and limited ability to pay in-lieu fees explain why so many on-site units are present in the Near North/Near West areas, especially compared to the downtown zone which is in the same region but had less strict rules.
While the Near North/West Pilot area may have yielded a higher number of on-site affordable units, the areas allowing in-lieu fees yielded a higher number of total units. That means more units in properties qualifying for the ordinance were developed in the higher income zone and the downtown zone, suggesting more development overall was taking place in these zones compared to the Near North/West Pilot area.
Another pilot area was the Milwaukee Corridor Pilot.68 The stated purpose was:
“to establish modified affordable housing requirements for designated neighborhoods along the Milwaukee corridor adjacent to the CTA’s Blue Line that are experiencing gentrification. The goals of these modified requirements are to mitigate the displacement impacts associated with gentrification, better protect the interests of the area’s economically vulnerable residents from demographic and housing market change, and preserve the economic diversity critical to a healthy economy.”
To do this, properties in this pilot area:
- Did not have the option to pay a fee in lieu of the establishment of affordable units.
- Were required to produce affordable units equal to 15%69 of the total units rather than 10% if on-site or 20% of the total units if any were provided off-site.
- Had to keep units affordable to households earning up to 60% of the area median income.
This pilot program produced 44 affordable units across nine developments over the six years it was in place.
This third pilot program differs from the first two in that it applied to the low-moderate income communities of Pilsen and Little Village.70 The Pilsen-Little Village pilot program’s stated purpose was:
“to establish modified affordable housing requirements for designated neighborhoods along the proposed El Paseo multi-use trail project that are experiencing gentrification. The goals of these modified requirements are to mitigate the displacement impacts associated with gentrification, better protect the interests of the area’s economically vulnerable residents from demographic and housing market change, and preserve the economic diversity critical to a healthy economy.”
To do this, properties in the Pilsen pilot area:
- Faced greater in-lieu fees: $178,469 per unit in Pilsen and $101,388 per unit in Little Village.
- Were required to produce affordable units equal to 20% of the total units rather than 10%.
- Were incentivized to build larger units in exchange for a reduced required number of affordable units.
- Were required to build all affordable units on-site.
Only one property qualifying for these guidelines was built and it generated three affordable units.
A breakdown of units for each of these pilot programs can be seen in Figure 7.
Whether units were built or in-lieu fees were paid under the standard Affordable Requirements Ordinance or in one of the pilot areas, they have been built in areas where incomes are typically higher to offset their cost.
Builders frequently preferred to pay in-lieu fees rather than build these units, paying $69 million dollars to forgo building 455 affordable units in the downtown zone. These in-lieu fees act as a “tax” on the cost of developing the unit, raising the cost of construction. For example, in the downtown zone these in-lieu fees come out to an average of $152,326 per unit. Added on to the $500,000 cost to build a typical unit downtown, that in-lieu fee paid to build a market-rate unit rather than an affordable unit has raised that price by about 30% to $652,326.71
The 2021 Affordable Requirements Ordinance made it much less financially viable to pay in-lieu fees instead of building the units, which explains the low number of paid units in each of the areas. The breakdown by area appears in Figure 8.
Only one of the 411 units generated by the 2021 ordinance to date has been in a low-moderate income zone. Most units built have been downtown, 61.6%. Other high-cost areas where units have been built are now labeled “inclusionary areas,” 25.3%, or areas where prices are rising labeled “community preservation areas,” 10.7%. See Figure 8.
The 2021 ordinance has only exacerbated the pattern of concentrating affordable properties in high-income, high-rent areas, seen in Figure 9. While it adjusted the zones and eliminated the pilot programs, the location of nearly all new units built was the same.
Even in buildings where units are built rather than paid for with in-lieu fees, these units represent a large subsidy that ultimately reduces the ability of developers to recoup their initial investments. The Fulbrix development is one example. This luxury apartment building in Fulton Market was approved under the 2015 ordinance and has 375 units, 75 of which are affordable to those living at or below 60% of the area median income. On its website, it indicates who qualifies based on family size.72
The average price of a studio apartment in the building is $2,534. The ordinance-mandated studios are priced at $1,227. For a one-bedroom apartment, the average price is $2,865 while the ordinance-mandated one-bedrooms are priced at $1,308. Two-bedrooms are $4,723 on average, while the affordable two-bedrooms are $1,569.
If all studio apartments in Fulbrix were market price, the amount of rent the property would need to charge to make the same amount it currently makes on these units would be reduced to about $1,892 per month. That means the 28 market-rate studio apartments are each paying an effective subsidy of $641 per month for the sake of affordable units. A similar calculation with larger units such as a one-bedroom reveals they’re paying about $310 each month. For two bedrooms, about $645.
Given the strong housing market in the Fulbrix neighborhood, the development could likely find renters without lowering the price. From that perspective, it’s the developers losing rental income from affordable units rather than market-rate residents. If all studio apartments in Fulbrix were charged the same average monthly rent, they would be bringing in over $35,200 dollars per month in rent. For one-bedrooms, $46,725 is being lost each month, and for two-bedrooms $56,775 each month. In just one month that’s almost $140,000 in missed rental income. Over a year, just over $1.6 million.
Either way, someone is bearing the costs of these units, and it’s likely a mix of the developer and the market-rate renter.
Systemic barriers to development: How Chicago’s strict zoning code drives unaffordability
Chicago’s unaffordability crisis has deep roots in the city’s housing policies and regulations. The city’s highly restrictive zoning code and slow permitting are primary drivers of unaffordability. They are exacerbated by the ordinance.
The city’s zoning code makes building multi-family housing difficult in the first place. Barely one-fifth of city land is zoned for multi-family housing and commercial use. Twice as much land is specifically zoned for single-family housing. There is 13% zoned as “planned developments unknown which allow residential,” meaning some of this land could in principle be used for either single- or multi-family housing. Residential property is not allowed on 25.1% of city land (Figure 10).73
Such strict zoning policy hurts housing development across the city. It discourages dense housing development. Developers who want to build more units than current zoning allows must comply with costly Affordable Requirements Ordinance rules, making many projects financially impractical. This further reduces housing supply and increases housing costs.
The most common building proposal that triggers the ordinance is a zoning change. Each year, between 80%-100% of projects subject to ordinance requirements are developments that need a zoning change.74 Developers often are requesting approval for greater density than existing zoning permits.
Chicago’s strict zoning code limits the construction of 10-plus multi-family buildings. Developers are incentivized to build projects under 10 units to avoid triggering the Affordable Requirements Ordinance, reducing the total housing supply. From 2010 to 2023, the number of housing units in buildings of 1-9 units increased by 73,364 units. In 10-plus unit buildings, it increased by 91,925 units. While it might appear at first glance the larger increase in 10-plus units indicates the ordinance’s success, it takes far fewer new projects to yield those additional units.75 Based on the number of units added in 50-unit plus buildings, the absolute maximum number of developments at that size would have been 1,206.76 By contrast, 39,591 units added in the 1-9 unit range were single-family developments or single-unit attachments. Many of these multi-family properties under 10 units could have been 10-plus unit buildings.
It’s important to note while inclusionary zoning hurts development, it doesn’t impact all 10-plus unit buildings. It only affects those that wish to build more than is allowed under the zoning regulations of a particular parcel of land. For example, 2533 N. Clark St. had zoning that would have allowed for the development of about 18 units, according to a Chicago Cityscape estimate.77 Instead, the developers wanted to build 24 units. Through the 2015 Affordable Requirements Ordinance, they had to build two “affordable” units to secure approval.
A comparison between the number of units in buildings that include Affordable Requirements Ordinance properties and the number of units that have been added to Chicago’s housing stock overall reveals about half of dwelling units in buildings with 10 or more units are in buildings impacted by the Affordable Requirements Ordinance.
One way developers can avoid these requirements is by building smaller 5-9 unit buildings rather than 10-19 unit buildings. Anecdotally, developers and real estate agents said that’s what has been happening. It is borne out by the data as well. From 2010 to 2023, 28,789 units were added in buildings 5-9 units while only 17,760 units were added in buildings 10-19 units.
This disparity is striking because in most cases there is enough space for a developer to build larger properties with additional stories. Assuming the average 5–9-unit building is 7.5 units, that is approximately 3,800 units. If half of those units, or 1,900, were instead 15-unit buildings, Chicago would have more than 14,200 additional units of housing in its housing stock right now. The gap is likely much larger, because many of these properties would be 19 units or more.
Another way developers can avoid the requirements is just building what’s allowed by the zoning code. Going back to the 2533 N. Clark St. example, the developers could have just built the 18-unit building originally allowed for in the zoning code.79 That would deprive the community of six housing units. Compounded across the city, that’s tens of thousands of units not being built. Anecdotally, it is clear this is happening based on conversations with developers.
The city’s zoning constraints have had long-term consequences for Chicago’s housing stock. It has been consistently lower than cities such as Houston and Los Angeles, which allow for much greater density (Figure 11).80
Chicago systematically makes it hard to build diverse types of housing to meet different needs. The city’s policy of additional dwelling units is telling. These granny flats, in-law suites and basement units can be added inside a house or in the backyard. Their small size and relative popularity as a housing solution would make them a great, naturally affordable solution.81 Chicago’s excessive restrictions and requirements have made that impossible.
For many years, these units weren’t allowed at all. That changed in 2021 when Chicago passed a pilot program that allowed additional dwelling units to be built in a few, small pilot areas.
While this change might seem promising, it remains extremely difficult to build an accessory unit in Chicago. Between affordability requirements and general red tape, the results are clear: people stop building. In 2022, while the city of Los Angeles permitted over 7,000 additional dwelling units and Seattle permitted nearly 1,000, the city of Chicago permitted only 109.82
One of the most problematic parts of the current policy is the affordability requirements. The city requires every other unit (for properties with more than two conversion units) be legally restricted affordable at 60% of the area median income for 30 years after its construction.83 What this policy does, similar to its effect on 10-plus unit buildings discussed above, is disincentivize the construction of more than two units, limiting the construction of new housing. This requirement comes on top of other elements of the policy that make it hard to build, especially on the South and West sides of Chicago where more affordable housing is most needed. These include owner-occupancy requirements, vacant lot construction bans and permit number limits.
With so many regulations, it’s not surprising permitting rates in Chicago are low when compared to other large cities. First, consider Los Angeles and Houston, the nation’s second and fourth largest cities. Since 2009, Los Angeles has been on a clear upward trajectory in permitting, going from 0.69 permits per 1,000 people in 2009, just after the financial crisis, to 4.61 in 2023. Houston has also been on a clear rise in permitting, going from 4 units per 1,000 residents in 2016 to 7.13 in 2023. Chicago, by contrast, has barely recovered from the 2009 crisis, and issued only 1.36 units per 100 residents. That’s less than half the number in 2002, before the first Affordable Requirements Ordinance took effect, when the city permitted 3 units per 1,000 residents.84
If Chicago permitted at a similar per-capita rate as Los Angeles in 2023, it would have produced 8,659 more units of housing in that year alone, an increase of 238%.85 If Chicago had matched Los Angeles’ permitting rate each year since 2016 when the most notable split occurs, they would’ve produced 46,798 additional units of housing, a nearly 89% increase.86
Chicago’s permitting rate lags way behind the top 10 biggest cities in the country, too.87 In 2023, the 10 largest cities permitted 4.71 units per 1,000 residents, while Chicago only permitted 1.36 per 1,000 residents. If Chicago had just achieved the average rate of the nation’s 10 cities, the city would’ve produced an additional 43,597 units of housing from 2016 to 2023.
The Affordable Requirements Ordinance worsens Chicago’s housing crisis by making density more difficult and costly. Instead of encouraging development, it operates as a tax on housing construction, discouraging investment and contributing to the city’s ongoing affordability issues. If Chicago wants to make housing more accessible, it must reform its zoning laws to allow for more development without harmful affordability mandates.
Chicago’s pathway to housing affordability
Proponents of inclusionary zoning tout the access it gives poorer families to better schools. A study of Montgomery County, Maryland, found “students whose families rented an affordable home in an inclusionary zoning development and attended a low-poverty elementary school did significantly better than their peers in traditional public housing who attended a moderate-poverty school.” The gains were substantial: “by the end of elementary school, the large achievement gap between children living in ‘set-aside’ homes who attended low-poverty schools and their non-poor classmates was cut by half for math and by one-third for reading.”88
As compelling as this data is, there’s a better way to provide low-income families access to better schools is to pursue housing abundance and allow for the construction of housing in all shapes and sizes to meet diverse needs. Here are proven reforms to accomplish that.
First, Chicago should directly address the Affordable Requirements Ordinance. The best policy would be to create a sunset date for the ordinance at the end of 2026, or at least in the next 3-5 years. After over 20 years, it’s clear the policy is not making housing more available or more affordable.
If sunsetting the ordinance is not politically possible, the next best option would be to offer a six-month “Affordable Requirements Ordinance holiday.” The ordinance would not apply to any developments submitted for approval during that period. This would let Chicago leaders see what would happen if they eventually did allow the ordinance to sunset. Based on feedback from developers, the city should expect a significant increase in housing production.
If the city is not prepared to sunset the ordinance, it could make it less burdensome in three ways. First, the city should reduce the percentage of units required to be offered at an “affordable” price, from 20% to no higher than 10%, which was the requirement until 2015. Second, the city should increase the size of developments to which the Affordable Requirements Ordinance applies to at least 20-unit buildings, and preferably 50-unit buildings. Third, the city should reduce in-lieu fees back to the 2007 rates of $100,000, then index it for inflation with the consumer price index. This would make it financially feasible for developers to pay them instead of providing “affordable” units.
Second, Chicago should reduce or eliminate parking requirements. The city recently passed Ordinance O2025-0015577, which waives minimum parking requirements for residential projects built within a 0.75 mile radius of public transportation. However, a carveout was made for downtown and parking exemptions in this region still require aldermanic approval. The cumbersome process of getting that exemption often poses unnecessary challenges for developers. The city should completely waive minimum parking requirements for residential projects that meet this public transit requirement downtown.
Third, mandating objective criteria and automatically approving delayed permits would provide developers with more certainty. It would allow them to know what was needed to get approved and when to expect answers from city leaders, reducing costs spent in drawn-out bureaucratic processes.
Mandating objective criteria is important because clear, objective housing criteria ensures fairer development processes. Subjective project approvals, such as those that take place under aldermanic privilege, provide an opportunity for corruption. Chicago would be a leader in the state by establishing a strict 60-day decision timeline for all permit applications rather than the average wait time of 76 days reported in August 2024.89 If no decision is made within that period, permits would be automatically granted. It keeps the process moving for housing projects, reducing administrative costs.
Finally, the city should relax restrictions on what types of housing can be built in residential areas. For example, an accessory dwelling unit is often a much less expensive housing option for lower-income families, and can be added to attics, basements and backyards in such a way that preserves the character of single-family neighborhoods. If these units are legal, families in wealthier neighborhoods can add them to have more household wealth. A low-income family can then rent this more affordable option and have access to better schools.
Comprehensive housing reforms such as these will help unlock housing abundance in Chicago.
Conclusions
Chicago is not the only city in Illinois to consider and eventually adopt an inclusionary zoning policy. Neighboring areas such as Evanston, Highland Park, Lake Forest and others have implemented similar programs to increase affordable housing.90 When so many neighbors are suffering under high housing costs, the impulse to do something is understandable. At some point, elected leaders are simply derelict in their responsibilities if they ignore the housing plight of low- and middle-income Chicagoans.
The city’s 20-plus year experiment in mandating affordability through inclusionary zoning is understandable. From a policy standpoint, the two-decade experiment is helpful, because now there is robust data to show what doesn’t work.
It’s time to adopt new policies that advance housing affordability in Chicago by pursuing housing abundance.
Across Illinois there’s a growing consensus about the causes and cures of the housing affordability crisis.
In 2024, both Illinois Gov. J.B. Pritzker and Chicago Mayor Brandon Johnson released reports acknowledging low supply is a key driver of housing unaffordability, and that harmful regulations are at the heart of this crisis. Johnson’s “Cut the Tape” report identified over 100 ways to make it easier to build housing. Pritzker’s “Missing Middle” report highlighted how low supply is squeezing families in the middle, too.
The path forward is becoming increasingly clear: let developers build diverse housing to meet people’s needs by removing burdensome regulations. This is the best path to provide housing that’s affordable to as many Illinoisans as possible.
Endnotes
1 Federal Reserve Bank of St. Louis. “Median Sales Price of Houses Sold for the United States.” Accessed July 22, 2025. https://fred.stlouisfed.org/series/MSPUS.
2 Joint Center for Housing Studies of Harvard University. “A Year for the Record Books: The State of the Nation’s Housing in Perspective.” December 21, 2023. https://www.jchs.harvard.edu/blog/year-record-books-state-nations-housing-perspective.
3 Corkery, Michael. “Case-Shiller Index: Boom Is Over, ‘Healthier’ Market Is Here.” Bankrate, June 25, 2024. https://www.bankrate.com/real-estate/case-shiller/#index.
4 Bandoch, Joshua, and Joe Tabor. “Regulatory Reform Can Make Housing More Affordable for Illinois Families.” Illinois Policy Institute, 2024. https://www.illinoispolicy.org/reports/regulatory-reform-can-make-housing-more-affordable-for-illinois-families/.
5 Reason Foundation. “Rent Control Laws Nearly Destroyed Parts of New York City. They Could Do the Same to California.” Accessed July 22, 2025. https://reason.org/commentary/rent-control-laws-nearly-destroyed-parts-of-new-york-city-they-could-do-the-same-to-california/.
6 Been, Vicki, Ingrid Gould Ellen, and Katherine M. O’Regan. “Supply Skepticism Revisited.” New York University School of Law and Robert F. Wagner Graduate School of Public Service, November 10, 2023. https://papers.ssrn.com/sol3/papers.cfm?abstract_id=4629628.
7 Ellickson, Robert C. “The Irony of ‘Inclusionary’ Zoning.” Southern California Law Review 54 (1981): 1185.
8 Harris, Connor. The Exclusionary Effects of Inclusionary Zoning. Manhattan Institute, 2020.
9 Li, Xiaodi. “Do New Housing Units in Your Backyard Raise Your Rents?” Journal of Economic Geography 22 (2022): 1309–1352.
10 Zillow. “Lake View Chicago IL Home Values.” Accessed July 22, 2025. https://www.zillow.com/home-values/269589/lake-view-chicago-il/.
11 Zillow. “Lincoln Park Chicago, IL Home Values.” Accessed July 22, 2025. https://www.zillow.com/home-values/269590/lincoln-park-chicago-il/
12 Wang, Ruoniu, and Sarah Balachandran. Inclusionary Housing in the United States: Prevalence, Practices, and Production in Local Jurisdictions as of 2019, pp. 5, 44, 46. Grounded Solutions Network, 2021. https://groundedsolutions.org/wp-content/uploads/2021-01/Inclusionary_Housing_US_v1_0.pdf.
13 Hamilton, Emily. “Inclusionary Zoning and Housing Market Outcomes.” Cityscape: A Journal of Policy Development and Research 23, no. 1 (2021): 172, 179.
14 Kober, Stephen. “De Blasio’s Mandatory Inclusionary Housing Program.” Unpublished manuscript, 2021.
15 Powell, Benjamin, and Edward Stringham. Housing Supply and Affordability: Do Affordable Housing Mandates Work?, p. 2. Independent Institute, 2005.
16 Brinker, Andrew. “’The numbers should work, but they just don’t’: Is Cambridge’s affordable housing rule backfiring?” Boston Globe, May 5, 2025. https://www.bostonglobe.com/2025/05/05/business/cambridge-affordable-housing-development/.
17 Means, Thomas, and Edward Stringham. “Unintended or Intended Consequences? The Effect of Below-Market Housing Mandates on Housing Markets in California.” Journal of Public Finance and Public Choice 30, no. 1–3 (2012): 39.
18 Powell, Benjamin, and Edward Stringham. Housing Supply and Affordability: Do Affordable Housing Mandates Work?, p. 4. Independent Institute, 2005.
19 Phillips, Shane. “Modeling Inclusionary Zoning’s Impact on Housing Production in Los Angeles: Tradeoffs and Policy Implications,” p. 9. Unpublished manuscript, 2020.
20 Cortright, Joe. “Inclusionary Zoning: Portland’s Wile E. Coyote Moment Has Arrived.” City Observatory, March 9, 2021. https://cityobservatory.org/inclusionary-zoning-portlands-wile-e-coyote-moment-has-arrived/.
21 Li, Fei, and Zhan Guo. “How Does an Expansion of Mandatory Inclusionary Housing Affect Neighborhoods?” Journal of the American Planning Association 88, no. 1 (2022): 83–100.
22 Cortright, Joe. “Inclusionary Zoning: Portland’s Wile E. Coyote Moment Has Arrived.” City Observatory, March 9, 2021. https://cityobservatory.org/inclusionary-zoning-portlands-wile-e-coyote-moment-has-arrived/.
23 Schuetz, Jenny, Rachel Meltzer, and Vicki Been. The Effects of Inclusionary Zoning on Local Housing Markets: Lessons from the San Francisco, Washington DC and Suburban Boston Areas, p. 65. Washington, DC: Brookings Institution, 2009.
24 Schuetz, Meltzer, and Been, The Effects of Inclusionary Zoning, 63.
25 Bento, Antonio, Scott Lowe, Gerrit-Jan Knaap, and Arnab Chakraborty. “Housing Market Effects of Inclusionary Zoning.” Cityscape: A Journal of Policy Development and Research 11, no. 2 (2009): 9.
26 Powell, Benjamin, and Edward Stringham. Housing Supply and Affordability: Do Affordable Housing Mandates Work?, p. 5. Independent Institute, 2005.
27 Madar, Josiah. Inclusionary Housing Policy in New York City: Assessing New Opportunities, Constraints, and Trade-offs, p. i. Furman Center for Real Estate and Urban Policy, 2011.
28 Valdez, Roger. “Inclusionary Policies End up Making Housing More Expensive.” Forbes, June 3, 2025. https://www.forbes.com/sites/rogervaldez/2025/06/03/inclusionary-policies-end-up-making-housing-more-expensive/.
29 Madar, Inclusionary Housing Policy in New York City, ii.
30 Bento et al., “Housing Market Effects of Inclusionary Zoning,” 9.
31 City of Chicago. Affordable Requirements Ordinance (ARO), 2021, Section J. https://codelibrary.amlegal.com/codes/chicago/latest/chicago_il/0-0-0-2693409.
32 Ellickson, Robert C. “The Irony of ‘Inclusionary’ Zoning.” Southern California Law Review 54 (1981): 1185.
33 Phillips, Shane. “Modeling Inclusionary Zoning’s Impact on Housing Production in Los Angeles: Tradeoffs and Policy Implications,” p. 17. Unpublished manuscript, 2020.
34 It’s important to note that while the AROs are the centerpiece of the city’s attempts to mandate affordability, the city has enacted a range of other measures, such as the 2004 Affordable Housing Zoning Bonus. We do not address them here because they are distinct from the city’s inclusionary zoning policies.
35 City of Chicago. Affordable Requirements Ordinance (ARO), 2003 with 2007 Additions, p. 11.
Aldermanic privilege is problematic in many ways. It erects an additional barrier to building housing: the whims and preferences of an alderman who gets to control what is and is not built in his ward. It also raises civil rights concerns. The Department of Housing and Urban Development has investigated Chicago for civil rights violations because of limits alderman placed on affordable housing projects using this “privilege.”36 It is impossible to assess the full impact of this “privilege” because this feudal mentality stops many housing projects before they even get started due to an alderman’s voiced disapproval.
37 City of Chicago, Affordable Requirements Ordinance (2003/2007), 4.
38 City of Chicago, Affordable Requirements Ordinance (2003/2007), 3.
39 City of Chicago, Affordable Requirements Ordinance (2003/2007), 7.
40 City of Chicago, Area Median Income (AMI) Chart, Department of Housing, accessed August 4, 2025, https://www.chicago.gov/city/en/depts/doh/provdrs/renters/svcs/ami_chart.html.
41 City of Chicago, Affordable Requirements Ordinance (2003/2007), 1, 7-8.
42 City of Chicago, Affordable Requirements Ordinance (2003/2007), 10.
43 City of Chicago Department of Housing. “Affordable Housing Opportunity Fund (AHOF).” Accessed July 22, 2025. https://www.chicago.gov/city/en/depts/doh/provdrs/developers/svcs/ahof.html.
44 City of Chicago, Affordable Requirements Ordinance (2003/2007), 8.
45 City of Chicago. Affordable Requirements Ordinance (ARO), 2015, Section A. https://codelibrary.amlegal.com/codes/chicago/latest/chicago_il/0-0-0-2599014.
46 City of Chicago. Affordable Requirements Ordinance (ARO), 2015, Section B.
47 City of Chicago. Affordable Requirements Ordinance (ARO), 2015, Sections B, C, and D.
48 City of Chicago. Affordable Requirements Ordinance (ARO), 2015, Section H.
49 City of Chicago. Affordable Requirements Ordinance (ARO), 2015, Section G.
50 City of Chicago. Affordable Requirements Ordinance (ARO), 2015, Section U.
51 City of Chicago. Affordable Requirements Ordinance (ARO), 2015, Section U.
52 City of Chicago. Affordable Requirements Ordinance (ARO), 2015, Section V.
53 City of Chicago. Affordable Requirements Ordinance (ARO), 2015, Section V.
54 City of Chicago. Affordable Requirements Ordinance (ARO), 2021, Section B.
55 City of Chicago. Affordable Requirements Ordinance (ARO), 2021, Section B.
56 City of Chicago. Affordable Requirements Ordinance (ARO), 2021, Section B.
57 City of Chicago. Affordable Requirements Ordinance (ARO), 2021, Section G.
58 City of Chicago. Affordable Requirements Ordinance (ARO), 2021, Section F.
59 City of Chicago. Affordable Requirements Ordinance (ARO), 2021, Section H.
60 City of Chicago. Affordable Requirements Ordinance (ARO), 2021, Section N.
61 City of Chicago. Affordable Requirements Ordinance (ARO), 2021, Section V.
62 City of Chicago. Affordable Requirements Ordinance (ARO), 2021, Section AA.
63 The data throughout this section comes from a Freedom of Information Act request sent to the City of Chicago. The data is current as of February 5, 2025.
64 U.S. Census Bureau. Building Permits Survey (BPS). Accessed July 22, 2025. https://www.census.gov/construction/bps/index.html.
65 Some entries recorded the unit types for the affordable units, while other entries recorded the unit types for all units in the building, and still others recorded no unit types at all. To make the best approximation, we removed the entries that listed the numbers for all units in the building. Due to this correction, the final number of units in Table 2 is slightly below what is projected in Table 1.
66 City of Chicago, Municipal Code of Chicago, American Legal Publishing (accessed August 4, 2025), https://codelibrary.amlegal.com/codes/chicago/latest/chicago_il/0-0-0-2599126.
67 City of Chicago. Affordable Requirements Ordinance (ARO), 2021. Projects receiving financial assistance must provide 20% affordable units.
68 City of Chicago, Municipal Code of Chicago, Chapter 244, Department of Housing, American Legal Publishing, https://codelibrary.amlegal.com/codes/chicago/latest/chicago_il/0-0-0-2598874.
69 City of Chicago. Affordable Requirements Ordinance (ARO), 2021. Projects receiving financial assistance must provide 20% affordable units.
70 Municipal Code of Chicago, § 244105 (Pilsen–Little Village affordable housing pilot area), accessed August 4, 2025, https://codelibrary.amlegal.com/codes/chicago/latest/chicago_il/0-0-0-2599189
71 Patrick Andriesen, “Chicago mayor spends $700 K per ‘affordable’ apartment unit,” Illinois Policy (December 12, 2024), accessed August 1, 2025, https://www.illinoispolicy.org/chicago-mayor-spends-700k-per-affordable-apartment-unit/.
72 Fulbrix Fulton Market, “ARO Plans,” Fulbrix Apartments (accessed August 1, 2025), https://fulbrix.com/aro-plans/
73 Bandoch, Joshua, and Joe Tabor. “Regulatory Reform Can Make Housing More Affordable for Illinois Families.” Illinois Policy Institute, 2024. https://www.illinoispolicy.org/reports/regulatory-reform-can-make-housing-more-affordable-for-illinois-families/.
74 Author’s analysis of the City of Chicago Department of Planning and Development’s 4th Quarter Housing Reports, 2003–2019, accessed via Chicago Rehab Network, https://www.chicagorehab.org/advocacy/city-policy/housing-quarterly-reports.
75 U.S. Census Bureau. Units in Structure: 2023 American Community Survey 1-Year Estimates, Table B25032, Chicago city, Illinois. Accessed August 4, 2025. https://data.census.gov/table/ACSDT1Y2023.B25032?t=Units+and+Stories+in+Structure&g=160XX00US1714000.
76 This is calculated by dividing the total number of units added in 50+ unit building over this time frame by 50. Each development in this section must have at least 50 units, so this calculation produces the maximum number of developments for buildings of this size. The real number was likely far below this as some buildings could have contained over 300 units, as the Fulbrix development did.
77 Chicago Cityscape Property Report for 2532 North Clark Street, Chicago, IL 60614, Chicago Cityscape (accessed August 4, 2025), under “Zoning Assessment” section, https://www.chicagocityscape.com/address.php?address=2532+N+Clark+St&city=Chicago&state=IL&lat=41.928731&lng=-87.642627&pin=14283130410000#zoning-assessment.
78 Author’s calculation based on Census Table B25024 and estimated unit sizes for developments in Chicago, assuming that all units added were in seven unit or 15-unit buildings. If half of the 7-unit developments instead built 15-unit buildings, it would’ve added 16,450 units to Chicago’s housing stock.
79 Chicago Cityscape Property Report for 2532 North Clark Street, Chicago, IL 60614, Chicago Cityscape (accessed August 4, 2025), under “Zoning Assessment” section, https://www.chicagocityscape.com/address.php?address=2532+N+Clark+St&city=Chicago&state=IL&lat=41.928731&lng=-87.642627&pin=14283130410000#zoning-assessment.
80 U.S. Census Bureau. “Units in Structure.” American Community Survey 1-Year Estimates Detailed Tables, Table B25024, 2010–2023.
81 Estabine, LyLena. “Chicago’s Hidden Housing Solution: How Additional Dwelling Unit Expansion Can Make City More Affordable.” Illinois Policy Institute, 2025. https://www.illinoispolicy.org/reports/chicagos-hidden-housing-solution-how-additional-dwelling-unit-expansion-can-make-city-more-affordable/.
82 Estabine, “Chicago’s Hidden Housing Solution.”
83 City of Chicago. “Additional Dwelling Units (ADU) Ordinance.” Accessed May 27, 2024. https://www.chicago.gov/city/en/sites/additional-dwelling-units-ordinance/home.html.
84 AEI Housing Center, “Housing Data App,” HEAT Toolkit (accessed July 31, 2025), https://heat.aeihousingcenter.org/toolkit/housing_data_app.
85 Calculation considers the difference between permits granted under Chicago’s actual per capita permitting rate in 2023 (1.36 per 1,000 people) versus what it would have been at Los Angeles’s per capita permitting rate in 2023 (4.61 per 1,000 people).
86 Calculation considers the difference between permits granted under Chicago’s actual per capita permitting rate from 2016 to 2023 versus what it would have been at Los Angeles’s per capital permitting rate from 2016 to 2023 and adds up the total number of additional permits that would have been granted over that time period.
87 Kapur, Sid. “Housing Data App.” AEI Housing Center, 2025. https://heat.aeihousingcenter.org/toolkit/housing_data_app.
88 Schwartz, Heather, Ksenia Petronko, and Kathryn Neckerman. Inclusionary Zoning Can Bring Poor Families Closer to Good Schools. MacArthur Foundation, March 2014. https://www.macfound.org/media/files/hhm_-_inclusionary_zoning_can_bring_poor_families_closer_to_good_schools.pdf.
89 City of Chicago. Department of Buildings. Accessed August 4, 2025. https://www.chicago.gov/city/en/depts/bldgs.html.
90 Summary of Illinois municipal inclusionary housing ordinances (Oak Park, St. Charles, Arlington Heights, Crystal Lake). Based on author’s review of local municipal codes, accessed July 22, 2025.